A ship in the harbor is safe, but that is not what ships are built for.
William Shedd
Tuesday, October 31, 2006
Monday, October 30, 2006
Chart of the Day - RRC
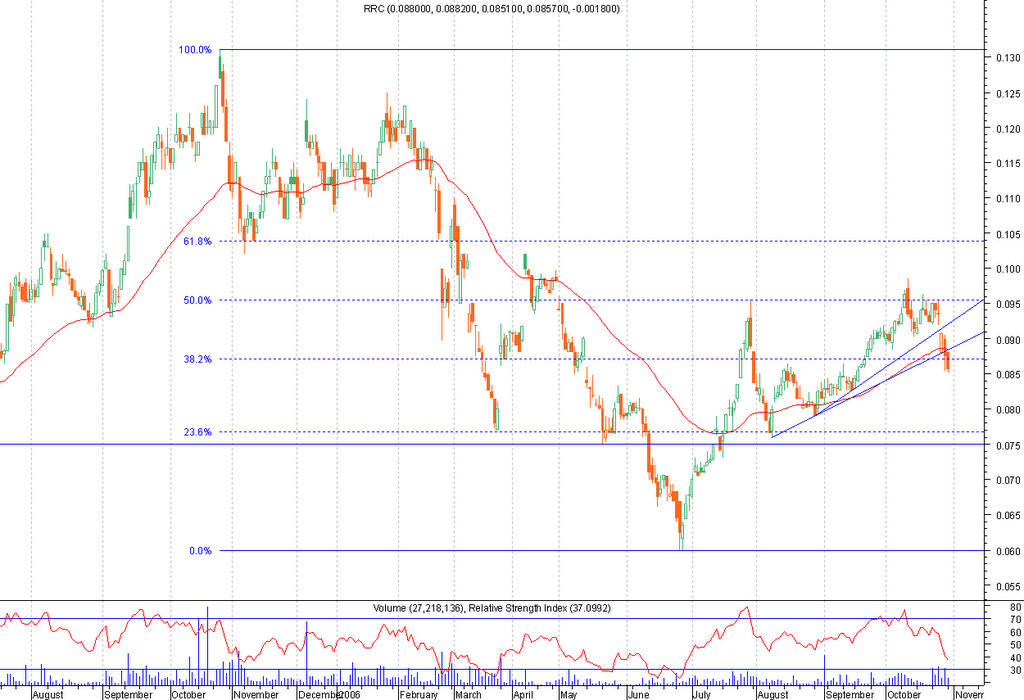
Dupa un nou esec de a trece de retragerea Fibonacci de 50% si dupa noi pierderi la 9 luni, vineri RRC a strapuns doua suporturi importante (media mobila de 50 de zile si o linie de trend ascendent provenind de la inceputul lui august) iar astazi a confirmat. Daca nu vor aparea cumparatorii la sustinerea pretului, urmatorul suport important se afla la 0.0750.
Sunday, October 29, 2006
BET-FI Proiectie
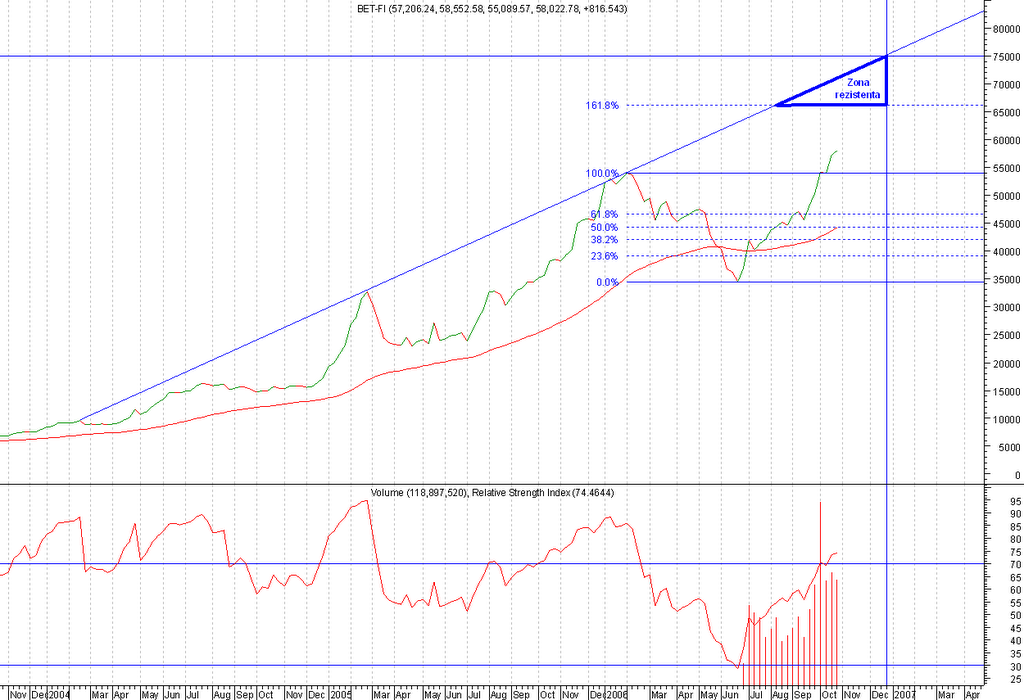
Indicele BET-FI ar putea sa-si incheie ascensiunea de Craciun sau la inceputul lunii ianuarie a anului viitor, folosind aceleasi reguli de proiectie ca si in cazul SIF5 sau SIF2 (extensia Fibonacci 161.8% si proiectia ultimei retrageri de 100%). Zona de rezistenta se gaseste intre 66.000 si 75.000 de puncte. Ramane de vazut cat de mare este precizia:))
Thursday, October 26, 2006
Chart of the Day - IMP

A venit randul Impact astazi sa strapunga reduta 61.8% a retragerilor Fibonacci. Se poate observa usor cum pretul a urcat fiecare treapta de retrageri..38.2%, 50% si 61.8%. Acum drumul este deschis catre maximul din mai de la 0.6500.
Thursday, October 19, 2006
Have The Courage Of Your Conviction
When we see something that makes sense, we're willing to act very fast and very big.
Warren Buffett
Source:
Trading Quotes
Warren Buffett
Source:
Trading Quotes
Wednesday, October 18, 2006
SIF2 Price Target

SIF2 probabil va intampina rezistenta intre extensia Fibonacci 161.8% de la 3.5 - 3.6 si proiectia ultimei retragerii Fibonacci de 100% aflata la 4.0 - 4.1 inainte de a incepe o corectie semnificativa spre suportul de la 2.75 (maximele din februarie 2006). Intalnirea proiectiei cu o linie de trend ascendenta din 2004 va avea loc la sfarsitul lui ianuarie/inceputul lui februarie 2007 cand trendul ascendent s-ar putea incheia.
Tuesday, October 17, 2006
SIF5 Price Target
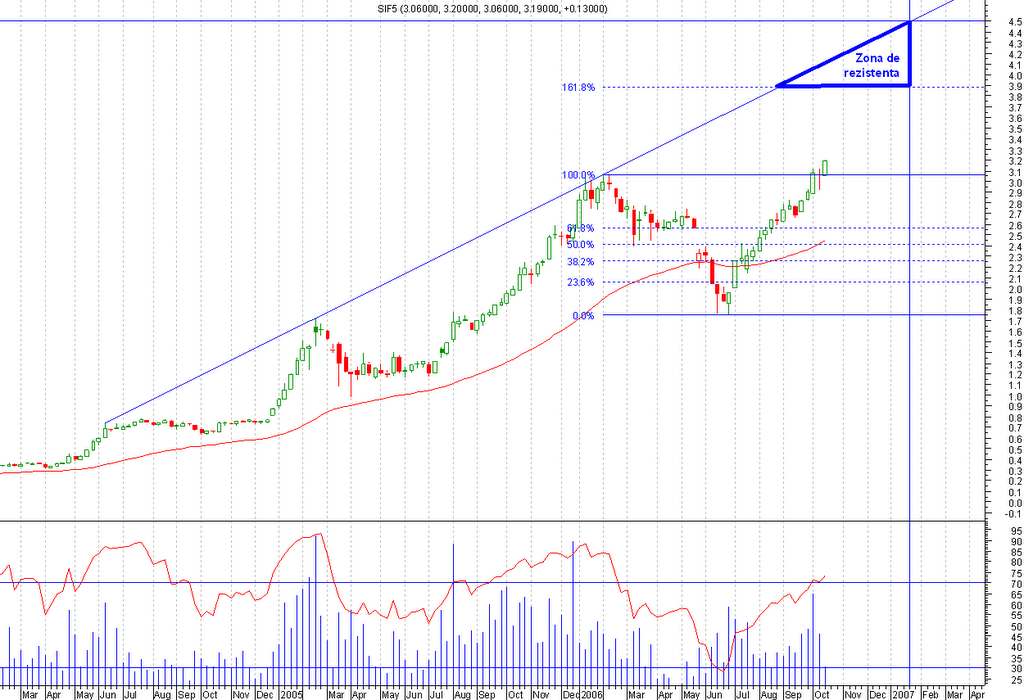
Dupa ce a depasit maximul de 3.07 din februarie, SIF5 cucereste noi teritorii si pare ca nu are nici un obstacol pana la 3.9 - 4.0. De acolo si probabil pana la 4.4 - 4.5, SIF Oltenia va intra intr-o zona de rezistenta care intr-un final ii poate curma ascensiunea si initia o corectie de mai lunga durata care va avea ca tinta maximele din februarie 2006 tocmai depasite.
Rezistenta de la 3.9 - 4.0 reprezinta o extensie de 161.8% a ultimei retrageri Fibonacci. Urmatoarea rezistenta de la 4.4 - 4.5 reprezinta o proiectie de pret egala cu retragerea Fibonacci de 100% de la minimul anului (1.75) la maximul din februarie (3.07). Aceasta ultima rezistenta se va intalni cu o linie de trend ascendent, pornita din 2004, la sfarsitul lui ianuarie 2007 cand probabil se vor marca topuri importante pe termen mediu si lung.
Monday, October 16, 2006
Quote of the Day
What can be added to the happiness of a man who is in health, out of debt, and has a clear conscience?
Sunday, October 15, 2006
Valute in oglinda
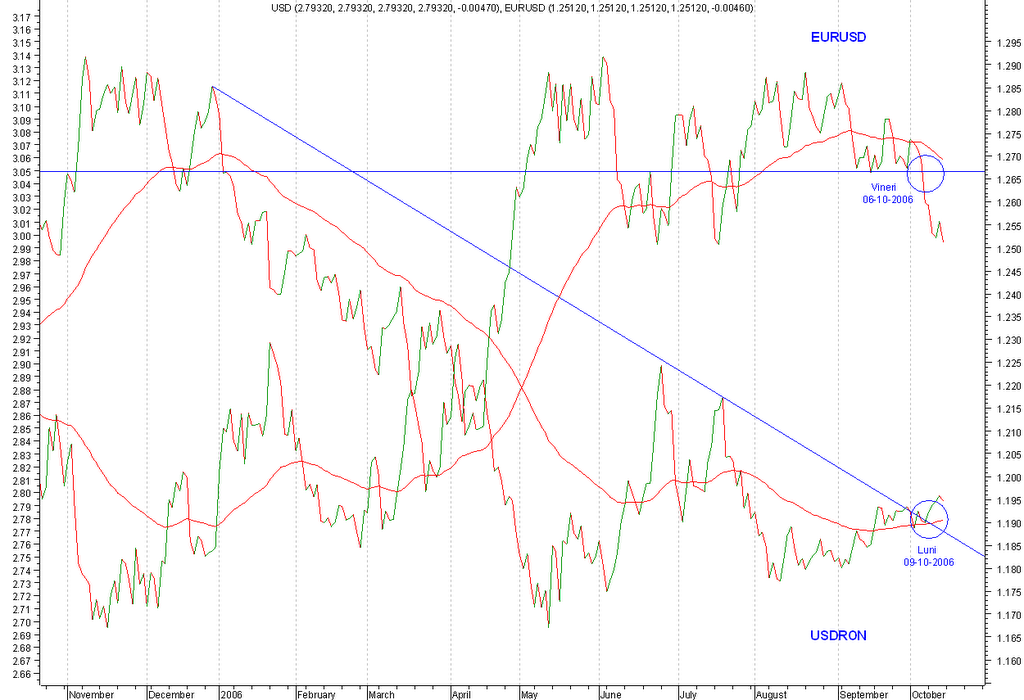
In chartul de mai sus am suprapus graficul USDRON si graficul EURUSD. Cele doua perechi de valute sunt invers corelate in proportie de 80% motiv pentru care nu este de mirare ca suprapunerea lor in acelasi chart ne arata ca o pereche este parca oglinda celeilalte. Mai mult, saptamana trecuta fiecare pereche a avut un breakout propriu si aproximativ simultan. In seara zilei de vineri, 06-10-2006, EURUSD a trecut printr-un suport important aflat aproape de 1.2600.
Deoarece BNR anunta cursul oficial USDRON la ora 13, cursul stabilit vineri nu a reflectat breakout-ul de seara al EURUSD. Reflectia s-a facut in cursul anuntat de BNR luni, 09-10-2006, si care provoca un breakout propriu USDRON, acesta trecand decisiv prin linia de trend ce cobora din decembrie 2005.
Is Gold trying to bottom?

The latest Commitment of Traders (COT) report shows the lowest net short commercial positions (82.602) since June 2005 and around the low of July 2005 (82.809). Gold used to bottom when the commercial COT numbers fell in 40.000 and 60.000 until spring 2005. Afterwards when the gold rally picked up speed, the bottoming took place between 115.000 and 130.000 net short commercial positions until September 2006 when gold COT numbers fell through 100.000 down towards the June 2005 lows.
Now we can assume that given the strong gold bull market, the bottoming may take place at higher levels (let’s say around 80.000). If this is the case, the bottom may be already in place since the latest COT number is around this figure.
Nevertheless, there is a warning signal given by the open interest. We notice in the chart above that every time gold is in a correction phase and falling, both open interest and commercial net short positions in gold (the absolute number of the COT numbers, the “-“ is just indicating we have net short positions) are falling. But during the last month, gold prices are falling, COT numbers are falling and the open interest is smoothly rising (see the thick indicating lines). What should this signal? A quick resume of the uptrend or just a warning sign that correction is not over yet and on the contrary it is here to last? The answer lies in the weeks ahead and the line in the sand is 600. Until then, no trade is the best trade!
The Commitment of Traders Report
"The Commodity Futures Trading Commission (CFTC) provides inside information about purchases and sales of futures contracts. The largest players in each market are required to disclose their positions to the CFTC on a daily basis and this report is released weekly on Friday afternoon (the reporting requirement varies by commodity). These traders are separated into Commercial Hedgers and Large Speculators. "
"The positions of Small Traders are calculated by subtracting the total of contracts held by the reporting groups from all the contracts outstanding (Small traders are not required to report their positions). Commercial Hedgers hold a significant informational edge over other traders as far as fundamental supply-and-demand statistics are concerned. They tend to be early, but they are usually right on the long run, quite contrary to the small traders. Extreme divergences in long and short positions of small traders, large speculators and commercial hedgers have proven to be reliable indicators of important trend changes. In such cases it is not advisable to bet against the commercial hedgers. All other patterns are meaningless."
Source:
Wall Street Courier
Saturday, October 14, 2006
Why Lower Oil Prices is Bad News for the U.S. Economy?
Here is an excerpt of the Nouriel Roubini's view on why US is heading for recession:
"In conclusion, the soft-landing bulls are getting it wrong and are altogether confusing cause and effect when they argue that lower oil prices are good news and good signals for future economic activity in the US: oil and commodity prices are exactly falling because we are now experiencing a US and global economic slowdown; so such price action should be interpreted as bad news rather than good news. This is the typical fallacy of non-economist that take a partial equilibrium – rather than a general equilibrium - approach to analyzing data; an economist would ask himself or herself: why are oil and commodity prices falling at the same time? What is the cause of it? There is only one clear and consistent explanation of this generalized price fall: the US is sharply slowing down dragging with itself the global economy. So, paradoxically falling oil prices are bad news for the economy: they are the proverbial canary in the mine warning us of the recession risks ahead. Indeed, what both the oil and commodity markets and the bond markets and the housing market are telling us - or screaming us - is: slowdwon and recession risks ahead!"
"The fact that the stock market is allegedly now providing a signal that is different from the bond market and the oil and commodity markets can be then interpreted - as I have since August - as the typical suckers' rally that accompanies slowdowns where the Fed is expected to come to the rescue of the market and the economy. Remember that in 2001 95% of all economic forecasters predicted in March 2001 no recession that year; too bad that the economy had already entered into a recession by March 2001. The wishful hope of forecasters and markets was that the Fed easing would rescue the economy and that the economy would experience a second half rebound. Indeed, in typical suckers' rally mode the S&P index rallied a whopping 18% in April and May 2001. It was only in June 2001 when even more severe signs of a recession clearly emerged that the stock market started to rapidly tank into a free fall. So, such stock markets suckers' rallies are very common at the outset of the recession. The reality is that stock markets are often wrong: sometimes they predict recessions that do not occur but, at times like in 2001, they fail to predict recessions that are already ongoing."
Source:
Friday, October 13, 2006
Chart of the Day - BIO

Astazi a venit si ziua Biofarmului sa treaca violent de ultima reduta Fibonacci (61.8%) si in acelasi timp pragul psihologic rotund de 0.6000, incercate de doua ori pana acum. Avem astfel si confirmarea tehnica a retragerii complete catre maximul din februarie de la 0.7150. De aici inainte, BIO are calea deschisa sa accelereze spre acest maxim.
Thursday, October 12, 2006

Wednesday, October 11, 2006
No Shame In Making A Mistake
There is no shame in making a mistake. Despite a great deal of research an analysis, I make plenty of them, and so does every other investor because the future is inherently unpredictable. But there is shame in refusing to acknowledge a mistake and rectifying it.
Source:
Tuesday, October 10, 2006
Quote of the Day
A successful trader studies human nature and does the opposite of what the general public does.
W.D. Gann
Monday, October 09, 2006
Interesting posts
The larger-than-normal expected benchmark revision of the Non-Farming Payrolls produced heavy discussions. Barry Ritholtz thinks the revision is absurd in An Absurdly Large Outlier in the History of BLS Revisions and Absurdly Large BLS Revisions, part II, while Felix Salmon from RGE Monitor says Payrolls: "Essentially unchanged" and The Skeptical Speculator deems that Rate cut hopes fall with unemployment.
It's worth reading the Commentary: Emerging markets drive forex reserves and see why the dollar is still strong.
Sunday, October 08, 2006
Gold corrective journey

After breaking the triangle, gold tested the first support I was discussing in a previous post, at around 575, then returned to the base of the broken triangle which strongly rejected it down through the 570-575 support area, opening up the decline towards the second significant support located around 540.
The weakness in commodities caused probably by the apparent American economic slowdown will keep the lid on any gold bullish bias in the near future and I think we will not see gold prices above 600 anytime soon.
Mr.Yen is on the move..

As I expected, the NFP on Friday gave the final push to the USDJPY through a 6-year trend line, opening the way to a strong resistance area located between 121.50 and 122.00.
The first number is a well tested support or resistance during the last 20 years and around 122.00 we have the 61.8% retracement level of the bearish trip from 135.19 to 101.65 between the end of 2001 and beginning of 2005.
If this resistance area is surpassed, a full retracement back to 135 may follow, but I believe there are fairly good chances this resistance turn back the Yen to the strong side.
Friday, October 06, 2006
NFP broke a neck today!:)

Nice technical setup today on 4 hour EURUSD charts. The NFP was the excuse of breaking the neck of this head & shoulders formation which also pierced a strong and significant support around 1.2630.
In the bigger picture, today's breakout should aim the next significant support around 1.2450 which is a 38.2% Fibonacci retracement of the trip from 1.1640 to 1.2980, a 200-day SMA (the EMA is at 1.2540) and two June and July lows (see the daily EURUSD chart below).

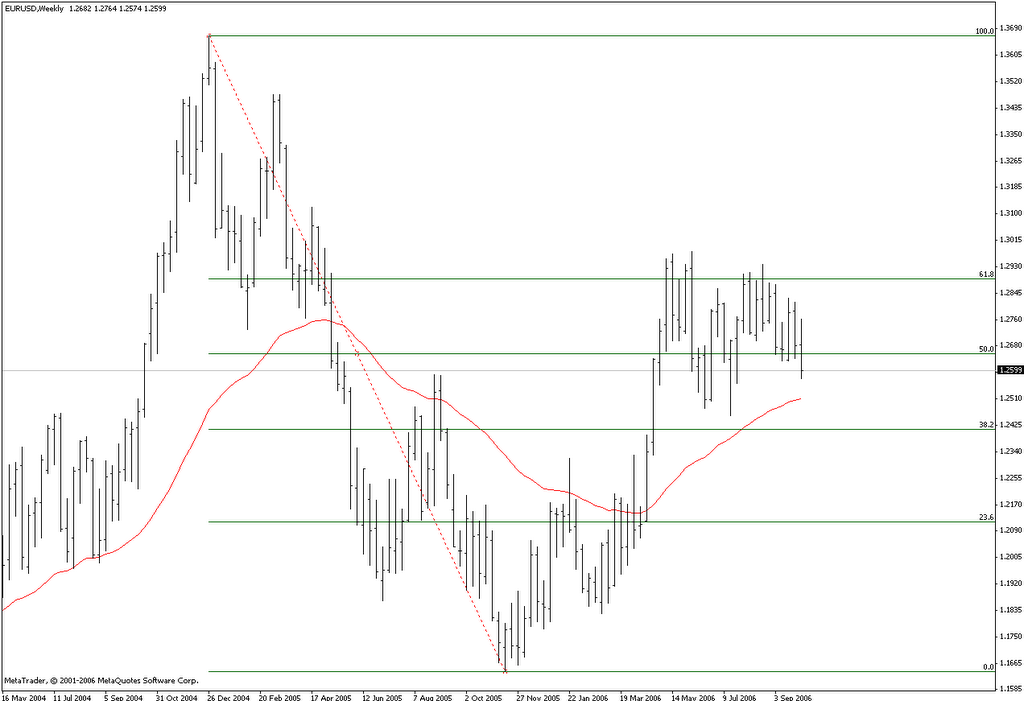
On a weekly EURSUD chart we notice that the last Fibonacci retracement (61.8%) of the fall from 1.3665 to 1.1640 was tested and marginally breached several times the last months but held well so far which may mean that a full retracement back to the 2004 highs is not yet in the cards and we need to wait a bit longer. It may also mean that a full retracement is not in the cards at all and the bearish trend started in 2005 will resume, but I place low odds to this last possibility given the overall fundamental view of both European and American economies. Anyhow, the good thing is that we shall probably see more action in the forex markets after this NFP Friday.
Thursday, October 05, 2006
Chart of the Day - BET
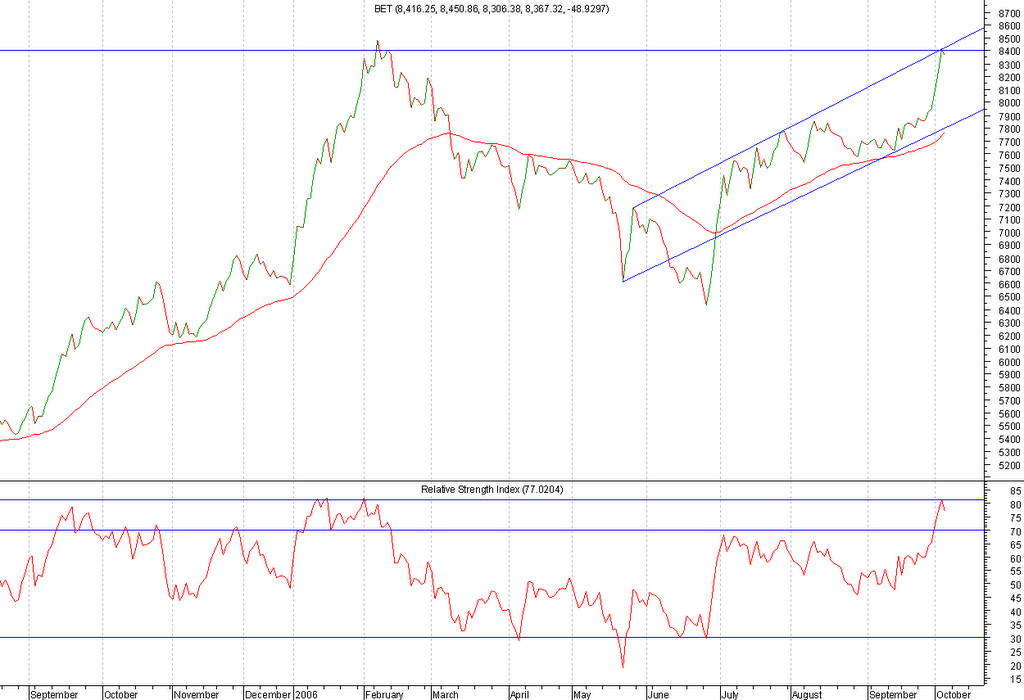
RSI atinge niveluri de "extreme overbought" iar cele doua rezistente desenate se intalnesc si sunt foarte puternice..pare sa fie momentul unei corectii..
Wednesday, October 04, 2006
Stop Deceiving Yourself
As investors, we deceive ourselves a thousand different ways, both small and large. We attribute gains to acumen when they are the product of luck, and attribute losses to ill fortune when they are often the product of stupidity or inattention.
Source:
Tuesday, October 03, 2006
Chart of the Day - SNP

Dupa multiple teste ale unei linii de trend suport pe care eu credeam intr-un post trecut ca o va strapunge, SNPul se intoarce si depaseste intr-un final rezistenta puternica de la 0.57 (un dublu top din lunile precedente si ultima retragere Fibonacci de 61.8%). Tehnic vorbind drumul spre maximul istoric de la inceputul anului (0.655) este deschis, daca nu cumva o stirea nefavorabila legata de actiunile acordate salariatilor la pret redus o va intoarce din drum..insa probabil pentru scurt timp.
O previziune remarcabila
Mi-am adus aminte de un articol mai vechi din Gandul in care Dragos Cabat, vicepresedintele CFA Romania pe care am avut onoarea sa-l si cunosc cu ceva ani in urma, facea o previziune interesanta si foarte ferma legata de evolutia bursei si a cursurilor de schimb si care s-a adeverit in totalitate cu o acuratete incredibila.
Iata ce spunea dansul in articolul cu pricina, aparut in 16 iunie 2006:
"Ma astept sa cada bursa, sa sufere o corectie de 10 la suta, in urmatoarele doua saptamani. De asemenea, ma astept la o depreciere a leului, probabil de 2-3 la suta".
In urmatoarele doua saptamani, BET-FI a cazut cu -10.17%, BET-C cu -4.24% si BET cu -3.50% in conditiile in care investitorii credeau ca scaderile pe indici era epuizate, iar leul s-a depreciat cu 3.2% fata de euro si cu 4.16% fata de dolar, in urma unor fluctuatii foarte violente a cursurilor de schimb.
Impactul factorilor externi de la momentul respectiv (in principal cresterea ratei dobanzii de catre FED) asupra pietelor financiare romanesti a fost foarte exact evaluat de domnul Cabat, facand o previziune de milioane la propriu pentru cei care initiau pozitiile de tranzactionare potrivite.
Chiar daca studiile americane arata ca prognoza economica este in general "about as good as guessing”, intotdeauna exista o exceptie care sa confirme regula si previziunea de mai sus este un bun exemplu!:)
Sursa:
Gandul, 16 iunie 2006
Monday, October 02, 2006
Chart of the Day - BCC
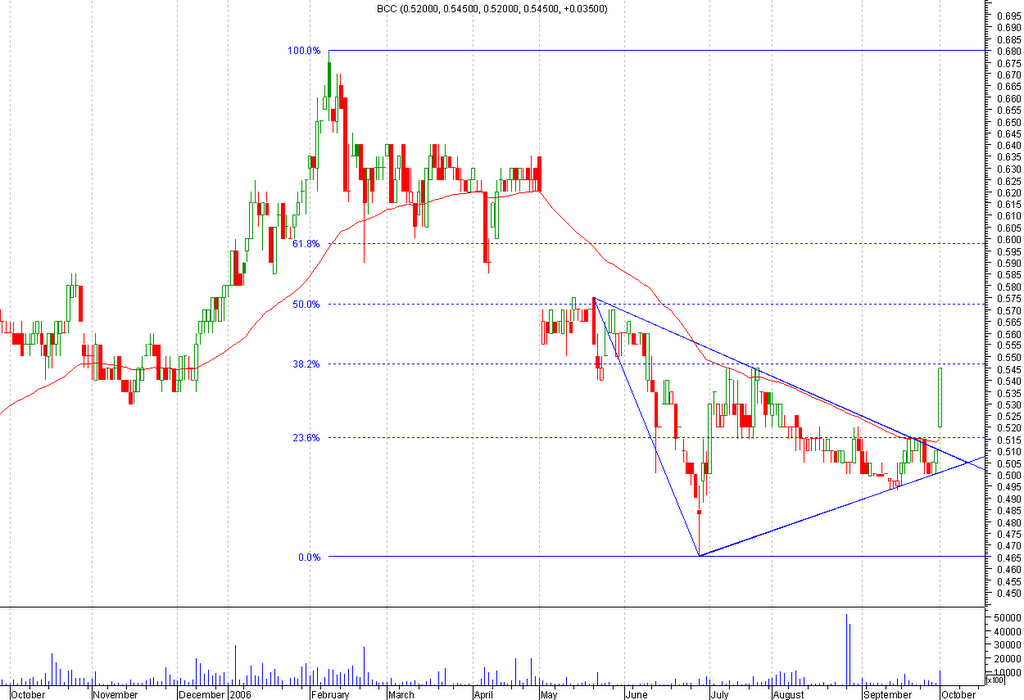
Breakout tehnic ajutat de stirea ca Banca Comerciala Carpatica vrea sa-si majoreze capitalul social.
Subscribe to:
Posts (Atom)