The main obstacle lies in distancing ourselves from our emotions.
Bernard Baruch
Source:
Trading Quotes
Thursday, November 30, 2006
Wednesday, November 29, 2006
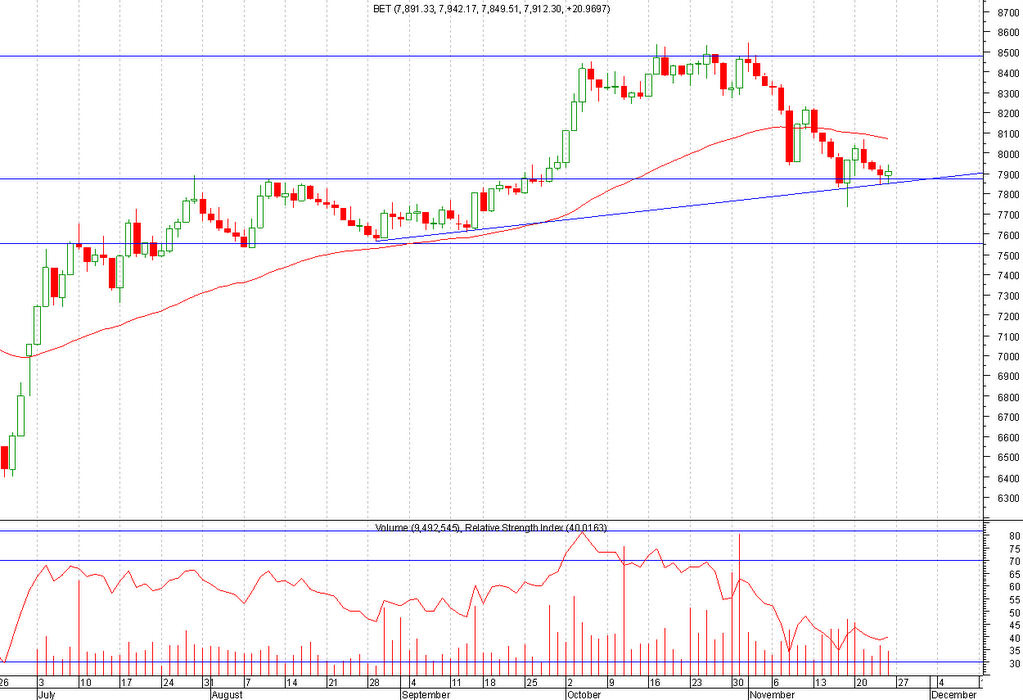
Chart of the Day - BET
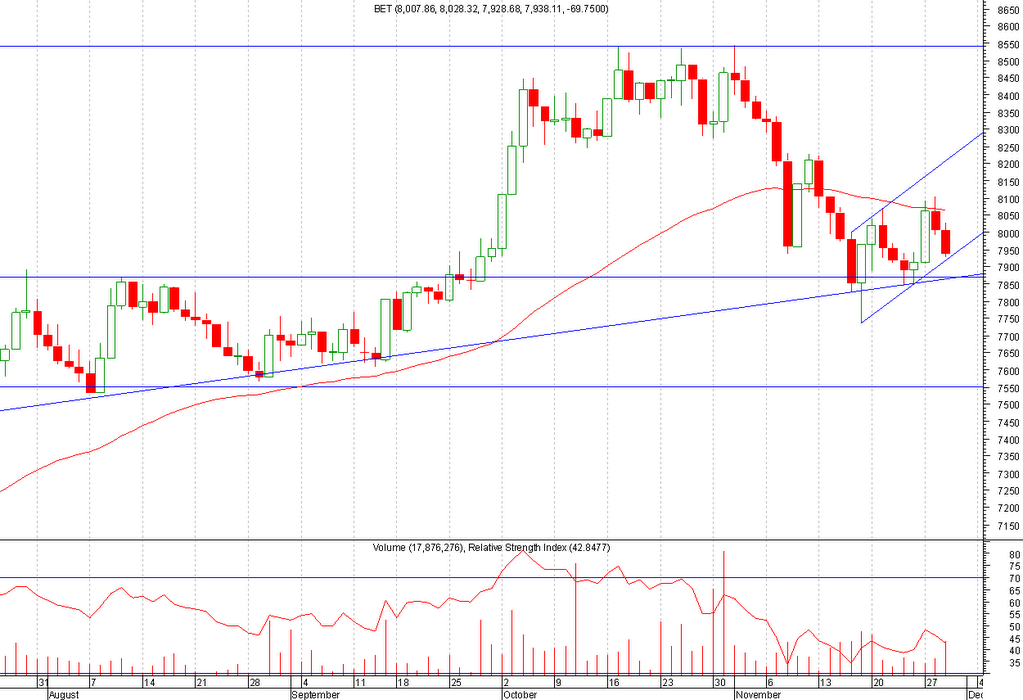
Incercarea indicelui de-a trece de linia mobila de 50 de zile a esuat luni si marti, astazi continuand pe scadere. Daca tentativa de canal ascendent va avea succes, vom afla maine, altfel scaderea va continua iarasi spre suportul din jurul valorii de 7.850.
Eurodollar may take a breather..

As we see on the daily chart above, a 261.8% Fibonacci extension (at 1.3217) of the last large bearish daily swing (1.2764 - 1.2483) has been reached.

On the weekly chart above wee see that the same top at 1.3217 is a 161.8% Fibonacci extension of the last large bearish weekly swing (1.2937 - 1.2483). We notice that the 261.8% Fibonacci extension is located exactly at the last 2004 highs (around 1.3665).
The 1.3217 top should act as intermediary resistance and trigger a correction that will offer new opportunities to enter long. The extent of the correction should not exceed 1.2980 (which was the top of the 6-month range) and be short-lived.
Tuesday, November 28, 2006
Warren Buffett..
Enjoy the guru..it's a pretty long recording but it's worth watching it!
Source:
Warren Buffett at The University of Florida
by Daily Dose of Optimism
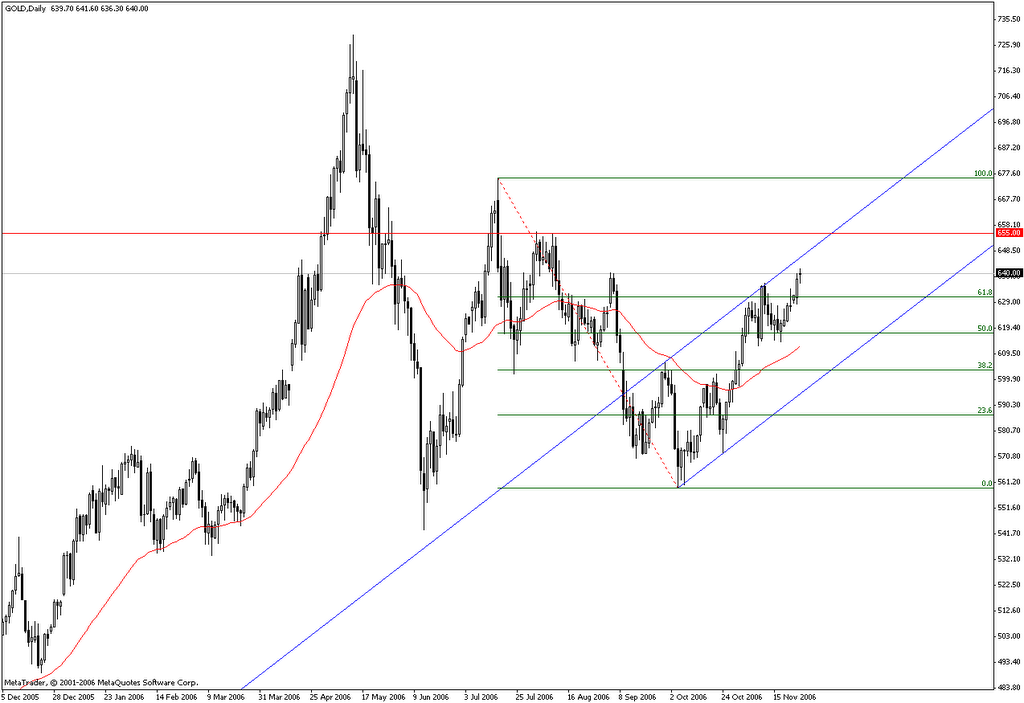
The Bullish GOLDen Route

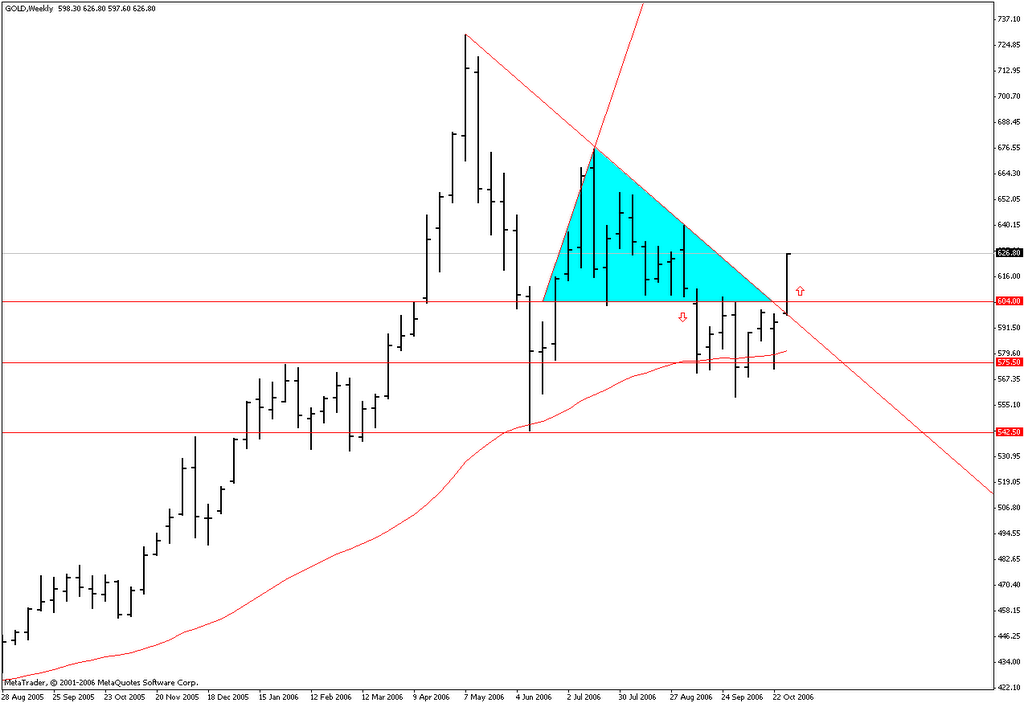
Gold has eventually managed to decisively break and close above the last Fibonacci retracement (61.8%) of the 676 - 559 trip and started the full retracement back towards 675, as noted in a previous post. The upper bull trend channel from October and the previous highs at around 655 might pose some resistance while 630 should become support.
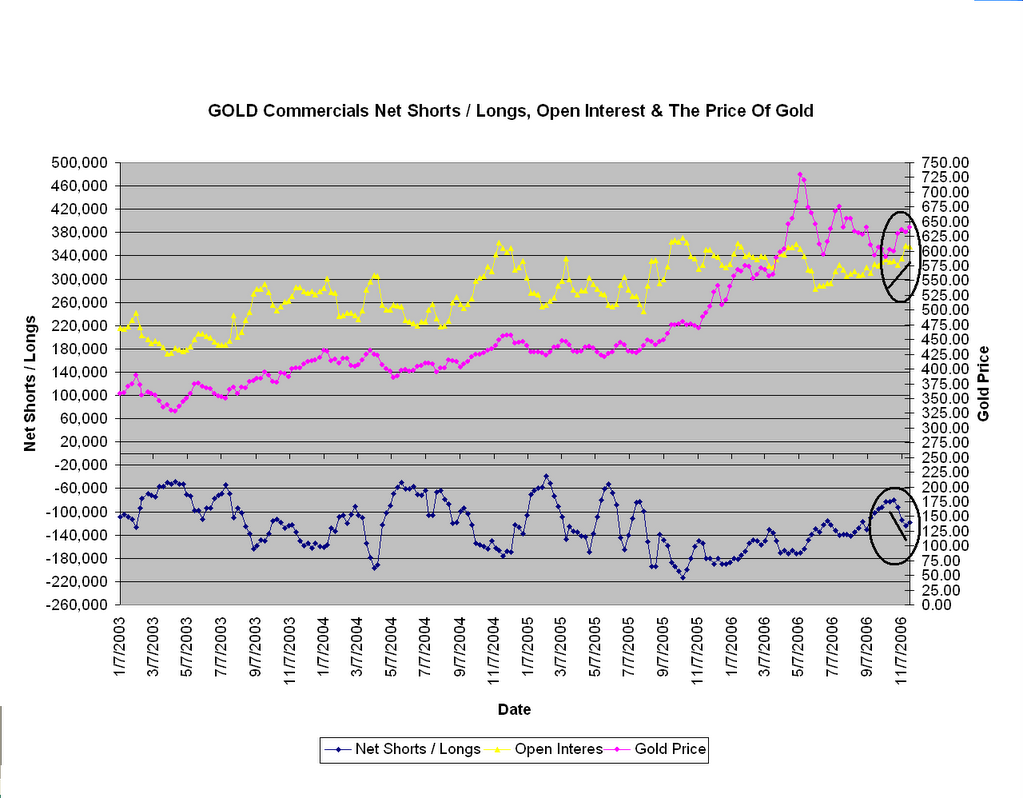
The bullish route is backed by higher commercials net shorts and finally by increasing open interest (as seen in the chart above) which strengthens the trend.
Monday, November 27, 2006
DJIA is finally plunging..
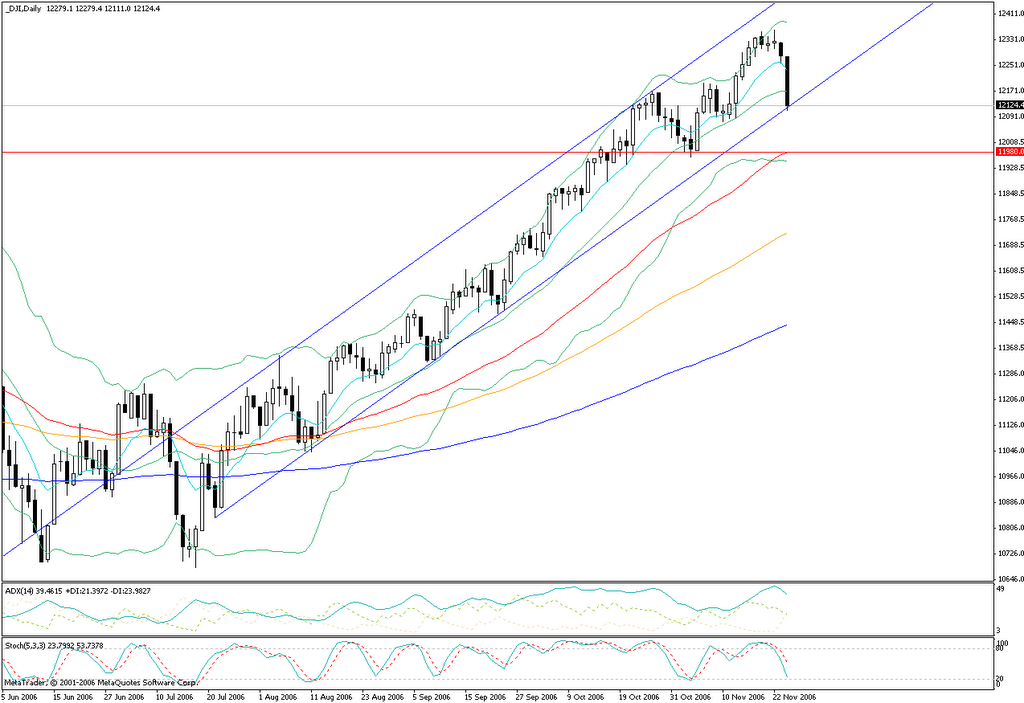
The panic correction day has come in US..on a Monday..kind of a Black Monday, though it's not that black..just yet. The lower bull trend channel propped the fall today and if it gives in tomorrow, the next significant support is around 11.980 which can still keep the bull trend alive in the short to medium term.
It will be interesting to watch how much this deep US stock market correction will influence other stock markets, including the Romanian one which closed positive today though the stock futures market closed pretty much in red (a rather unusual event).
A possible explanation of the plunge..
"CNBC's Bob Pisani quotes several unnamed traders who have said that in light of the dollar drop, overseas investors are repatriating some cash, locking in their profits for the year, and eliminating additional currency risk . . . "
Source:
A Story About Trading..:))
"There's a great story about a famous local trader at the Chicago Board of Trade (CBOT). One day, he was on the floor of the CBOT and a U.S. inflation number came out that was totally unexpected. Pure pandemonium ensued. When all the noise died down, he walked out of the pit having made $10 million and said, "By the way, what was the number?"
Source:
Quote of the Week
by TaylorTree
Chart of the Day - RRC: Revenirea..

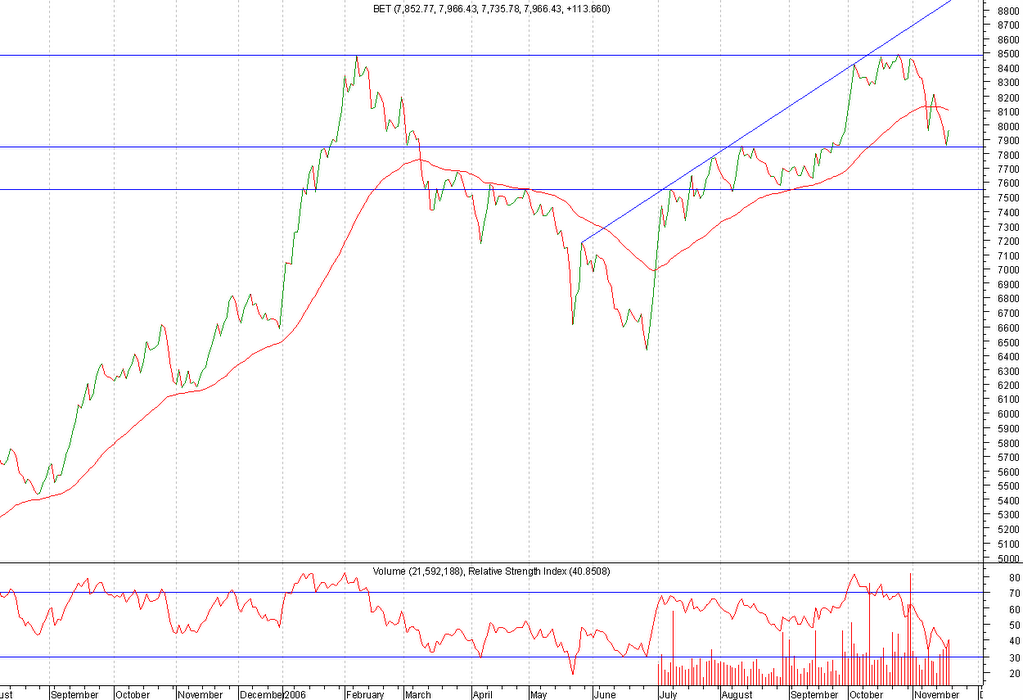
BET on BET
Indicele BET a rezistat saptamana trecuta deasupra maximelor verii si a liniei de trend crescator venita de la sfarsitul lui august, corectand cele doua zile de cresteri impulsive de acum o saptamana si nefacand noi minime. Zona in care se afla este critica, o nou scadere serioasa sub ultimele minime putand declansa o scadere abrupta spre urmatorul suport dintre 7.500 - 7.600. Daca acest lucru nu se va intampla, putem asista la o reluare a trendului crescator. Asadar let's BET on BET daca vom avea o noua saptamana de scaderi sau reluarea cresterilor!:))

BET-FI a facut noi maxime istorice marginale la inceputul saptamanii si a inceput o corectie care ar putea continua. Cu toate acestea, zona 56.500 - 57.000 pare sa fie un suport puternic, intarit acum si de linia mobila de 50 zile + prima retragere Fibonacci (23.6%) si deci e putin probabil ca BET-FI sa faca noi minime pe aceasta corectie.
Sunday, November 26, 2006
The eurodollar has escaped the leash
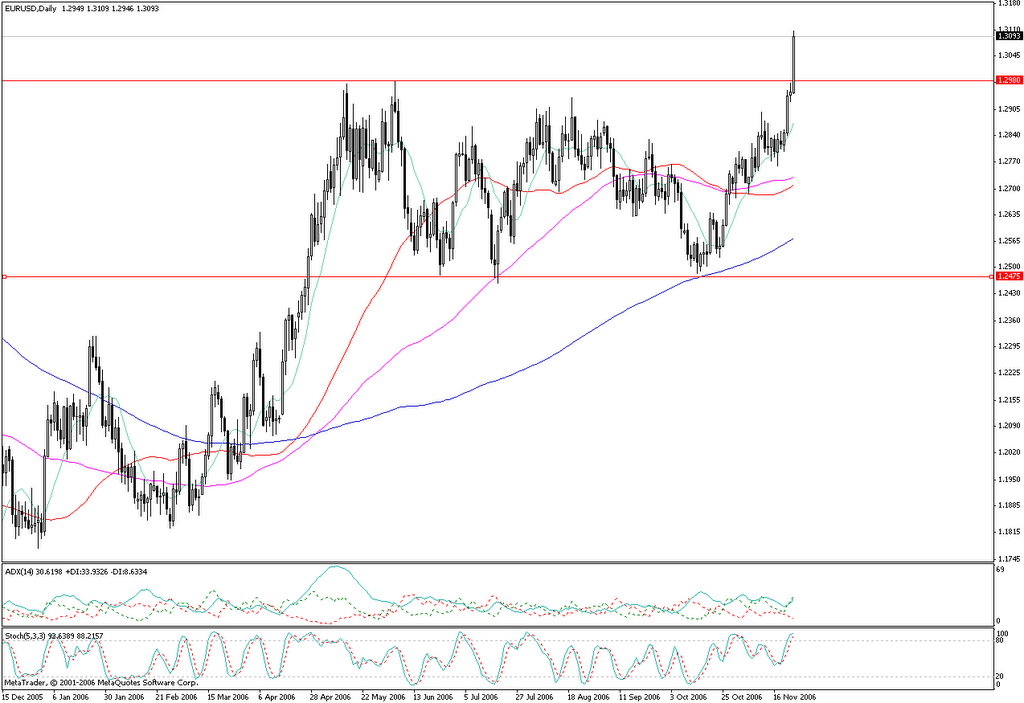
As observed in a previous post, the dollar weakness resumed and the long waited EURUSD breakout of a 6 month range and the break of an inverse head and shoulders neck eventually happened on Friday. On the daily chart above there are several technical indicators that support a continuation of the bullish trend. Apart from the breakout resistance that should become support at around 1.2980, we have a 10-day moving average at around 1.2875 which has been well tested since the end of October indicating a bullish sign and ascending support. The ADX is at trending levels (30 on Friday, a minimum of 25 is needed) with +DI furthering away from -DI and the Stochastic indicator reaches overbought levels but it prepares to stay there for a longer period of time.

On a monthly chart (above) we see that last week we had a break of the last Fibonacci retracement (61.8%) of the 1.3665 - 1.1640 trip, a break which this time was confirmed by a close above the Fibo level. This chart shows us two potential resistance levels before the last top (at 1.3665). The first one is around 1.33 (previous tops from a time when the chart was drawn using a basket of the currencies that disappeared when euro appeared in 1999) and the second one is towards 1.35 where we have a downward trend line coming from the 1995 highs.
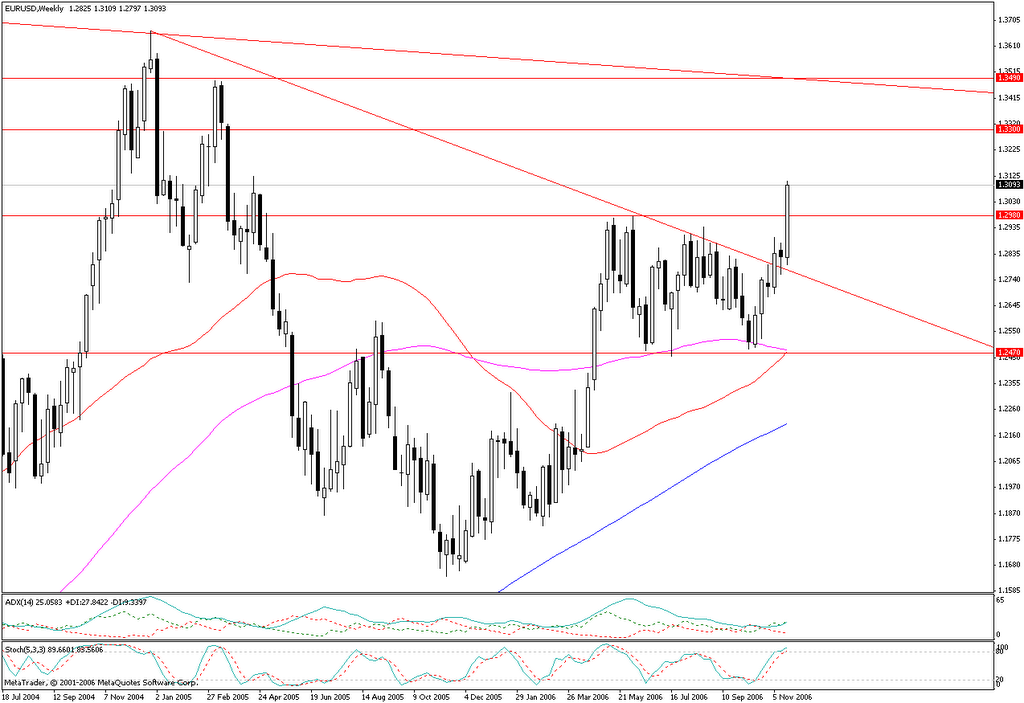
The weekly chart (above) shows us the downward trend line broken two weeks ago and the breakout of a 6-month-500-pip range. The EURUSD may run at least another 500 pips toward 1.35 where we have the 1995 started downward trend line we've seen on the monthly chart. Both ADX (25) and Stochastic are at trend ready levels but need confirmation. The same is true for the 50 day moving average which is about to cross the 100 day moving average. Since these crosses are lagging indicators of a trend, we can only imagine that we have a continuation of the bullish trend which will be confirmed at a later time by the crossing of the said moving averages.
Saturday, November 25, 2006
DENNIS GARTMAN'S NOT-SO-SIMPLE RULES OF TRADING
1. Never, Ever, Ever, Under Any Circumstance, Add to a Losing Position... not ever, not never! Adding to losing positions is trading's carcinogen; it is trading's driving while intoxicated. It will lead to ruin. Count on it!
2. Trade Like a Wizened Mercenary Soldier: We must fight on the winning side, not on the side we may believe to be correct economically.
3. Mental Capital Trumps Real Capital: Capital comes in two types, mental and real, and the former is far more valuable than the latter. Holding losing positions costs measurable real capital, but it costs immeasurable mental capital.
4. This Is Not a Business of Buying Low and Selling High; it is, however, a business of buying high and selling higher. Strength tends to beget strength, and weakness, weakness.
5. In Bull Markets One Can Only Be Long or Neutral, and in bear markets, one can only be short or neutral. This may seem self-evident; few understand it however, and fewer still embrace it.
6. "Markets Can Remain Illogical Far Longer Than You or I Can Remain Solvent." These are Keynes' words, and illogic does often reign, despite what the academics would have us believe.
7. Buy Markets That Show the Greatest Strength; Sell Markets That Show the Greatest Weakness: Metaphorically, when bearish we need to throw rocks into the wettest paper sacks, for they break most easily. When bullish we need to sail the strongest winds, for they carry the farthest.
8. Think Like a Fundamentalist; Trade Like a Simple Technician: The fundamentals may drive a market and we need to understand them, but if the chart is not bullish, why be bullish? Be bullish when the technicals and fundamentals, as you understand them, run in tandem.
9. Trading Runs in Cycles, Some Good, Most Bad: Trade large and aggressively when trading well; trade small and ever smaller when trading poorly. In "good times," even errors turn to profits; in "bad times," the most well-researched trade will go awry. This is the nature of trading; accept it and move on.
10. Keep Your Technical Systems Simple: Complicated systems breed confusion; simplicity breeds elegance. The great traders we've known have the simplest methods of trading. There is a correlation here!
11. In Trading/Investing, An Understanding of Mass Psychology Is Often More Important Than an Understanding of Economics: Simply put, "When they are cryin', you should be buyin'! And when they are yellin', you should be sellin'!"
12. Bear Market Corrections Are More Violent and Far Swifter Than Bull Market Corrections: Why they are is still a mystery to us, but they are; we accept it as fact and we move on.
13. There Is Never Just One Cockroach: The lesson of bad news on most stocks is that more shall follow... usually hard upon and always with detrimental effect upon price, until such time as panic prevails and the weakest hands finally exit their positions.
14. Be Patient with Winning Trades; Be Enormously Impatient with Losing Trades: The older we get, the more small losses we take each year... and our profits grow accordingly.
15. Do More of That Which Is Working and Less of That Which Is Not: This works in life as well as trading. Do the things that have been proven of merit. Add to winning trades; cut back or eliminate losing ones. If there is a "secret" to trading (and of life), this is it.
16. All Rules Are Meant To Be Broken.... but only very, very infrequently. Genius comes in knowing how truly infrequently one can do so and still prosper.
Source:
It's All About Your Time Frame
by John Mauldin
Sunday, November 19, 2006
Predictie BET Reloaded
Predictia BET de duminica trecuta a fost infirmata de piata, inchiderile nedecise ale celor mai importante titluri componente ale indicelui dand nastere la noi scaderi in saptamana ce tocmai a trecut. Inchiderea de vineri insa, desi fortata pe ultimele minute ale sedintei de tranzactionare, da semnale de intoarcere.
Indicele BET atinge maximele din august care s-au transformat din rezistenta in suport si se intoarce nervos, putand astfel semnala o intoarcere pentru saptamanile urmatoare.
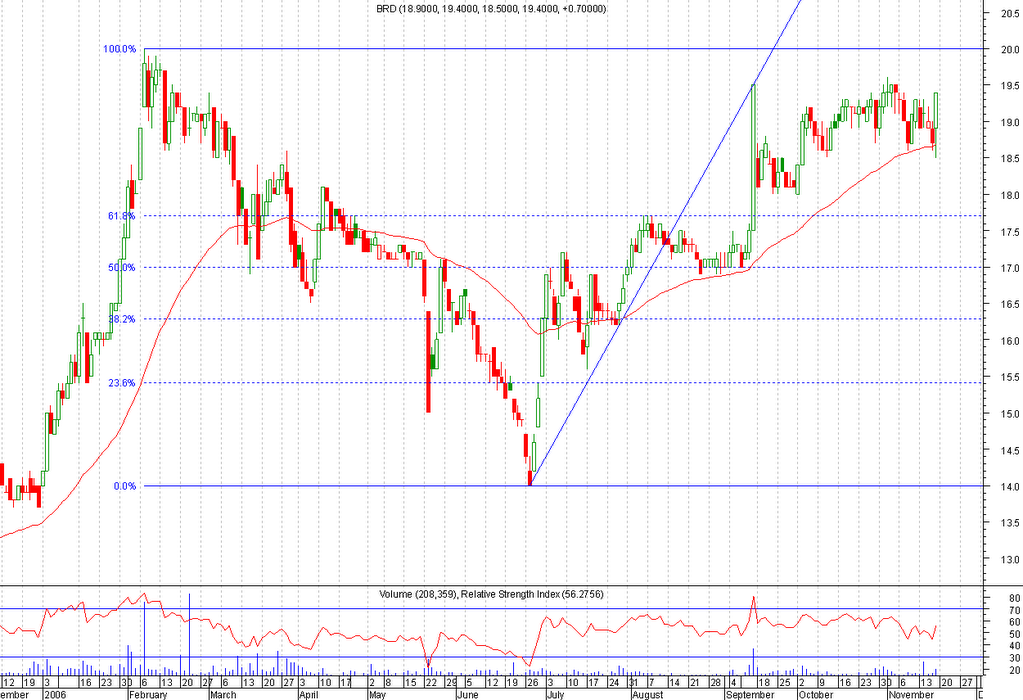
BRD inteapa media mobila suport de 50 zile si se intoarce apoi peste maximele ultimelor doua saptamani.
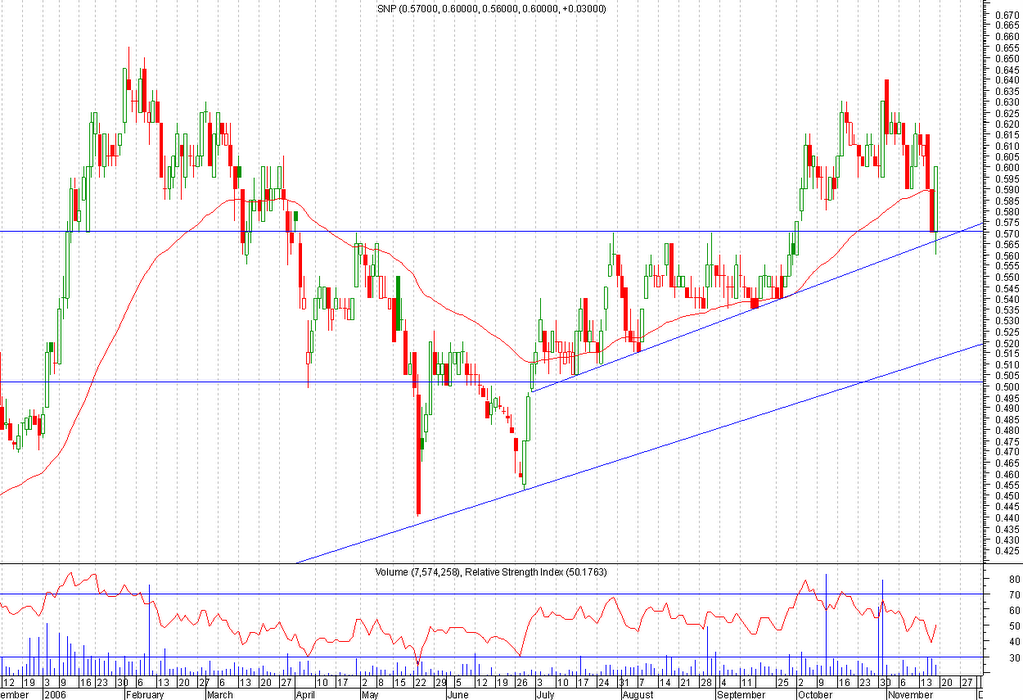
SNP inteapa suportul aflat la 0.57 si o linie de trend ascendent venita din iulie apoi se intoarce peste inchiderea din ziua precedenta si peste media mobila de 50 zile.

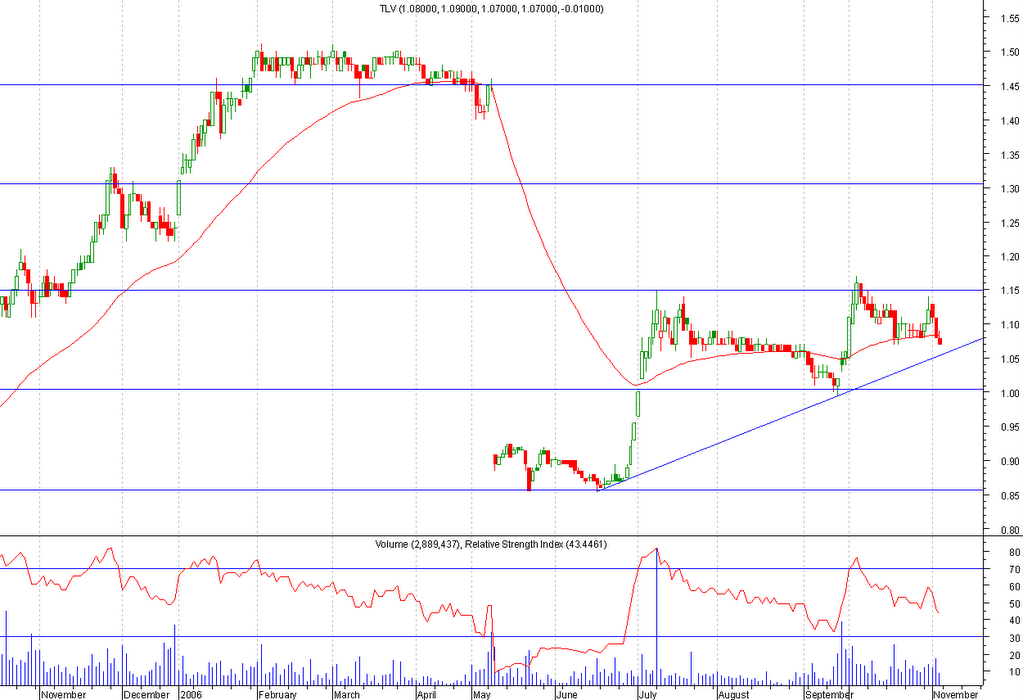
TLV inteapa adanc suportul si posibila baza de range de la 1.0 si inchide tot acolo, dar inca nu sunt destule semnale pentru o intoarcere desi pot aparea curand.
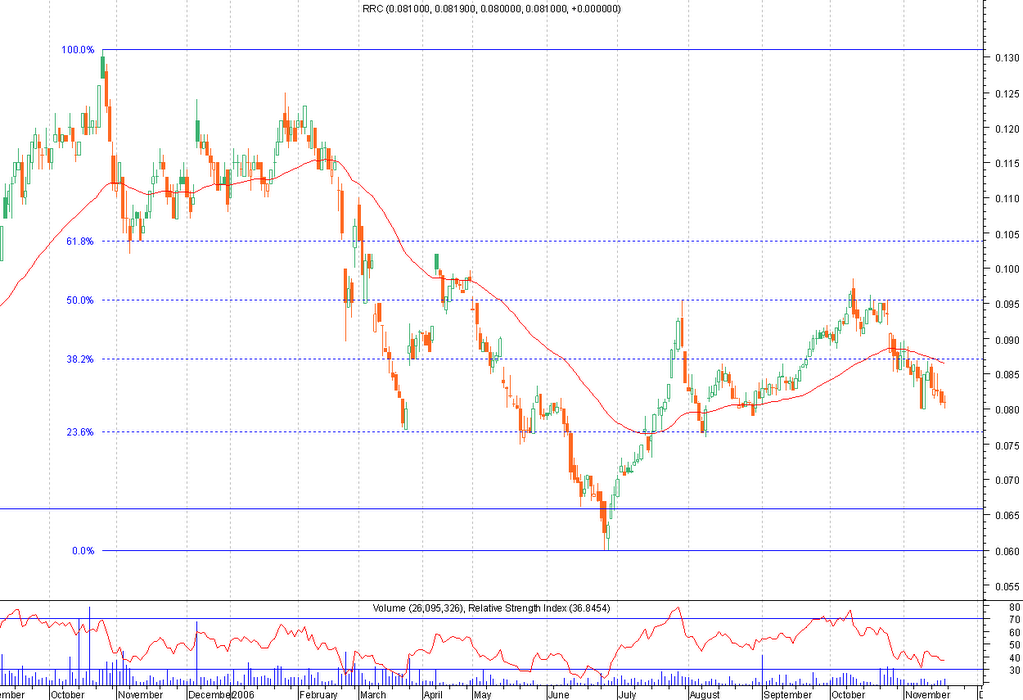
RRC incheie ultima zi a saptamanii intr-un "Doji", adica indecis, dar care se poate constitui in semnal de intoarcere venind dupa cateva zile de scaderi, insa trebuie confirmat.

SIF2 se apropie foarte mult de maximele din februarie transformate in suport cat si de media mobila de 50 zile dar este intors violent si inchide ziua de vineri pe plus intr-o lumanare care poate semnifica intoarcere.

SIF5 inchide ziua de vineri la acelasi pret la care a deschis-o, dar dupa o incursiune adanca spre suportul reprezentat de maximele din octombrie si media mobila de 50 zile. Iarasi semnal de intoarcere, daca va fi confirmat maine.
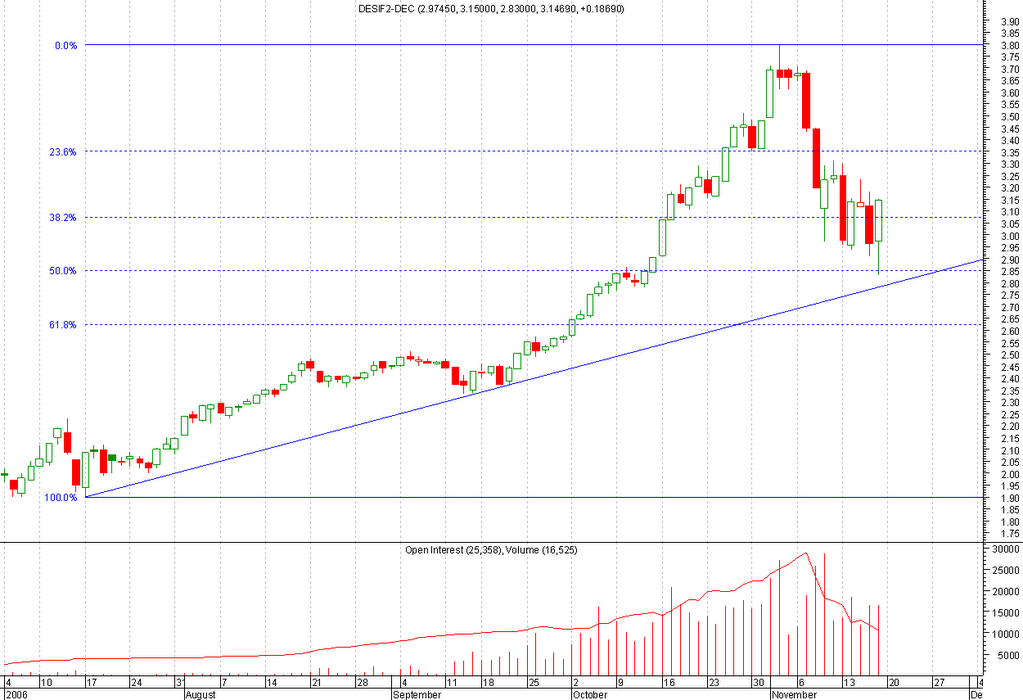
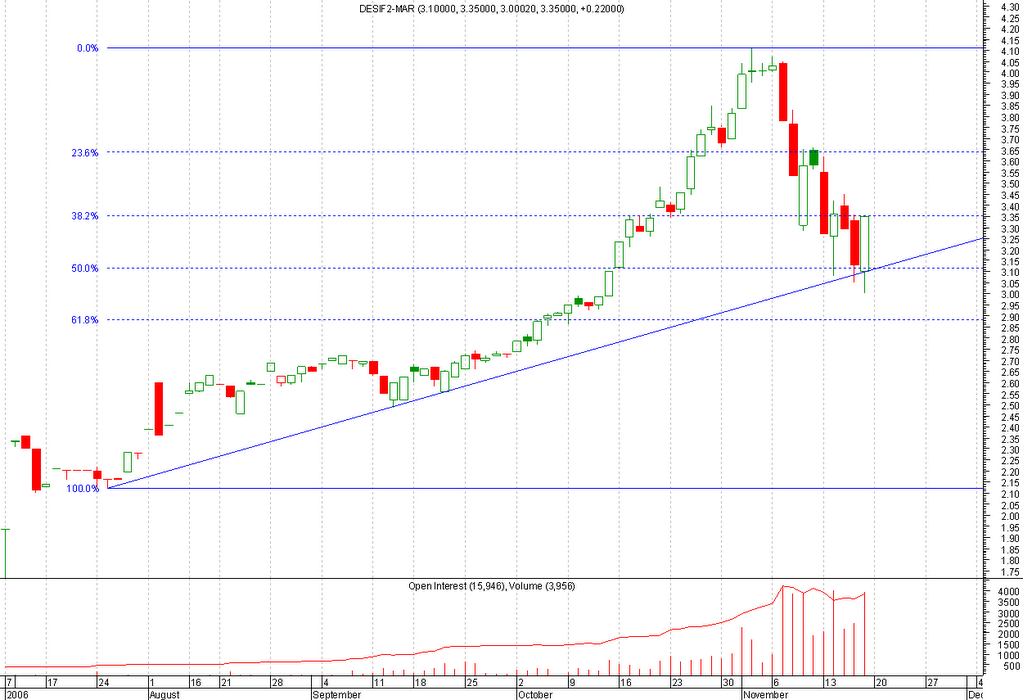


Vineri la BMFMS, DESIF2 si DESIF5 DEC06 si MAR07 au testat minimele de marti sau au facut alte minime marginale dupa care s-au intors cel putin peste maximele din ziua precedenta dand semnale de intoarcere (spre deosebire de vinerea trecuta cand inchiderile au fost sub forma de "shooting star", adica semnaland scaderi). De asemenea se poate observa ca pe futures corectia pe derivatele ambelor SIFuri si pe cele doua scadente a fost de 50% si 61.8%, deci daca ne aflam in continuare pe un trend ascendent pe termen mediu, am putea spune ca minimele corectiei au fost deja atinse.
Asadar avem destule semnale care sa ne indice o incheiere a corectiei atat pe SIFuri cat si pe BET, dar aceste semnale trebuie confirmate in primele zile ale noii saptamani. Sa le vedem..
Saturday, November 11, 2006
Predictie BET

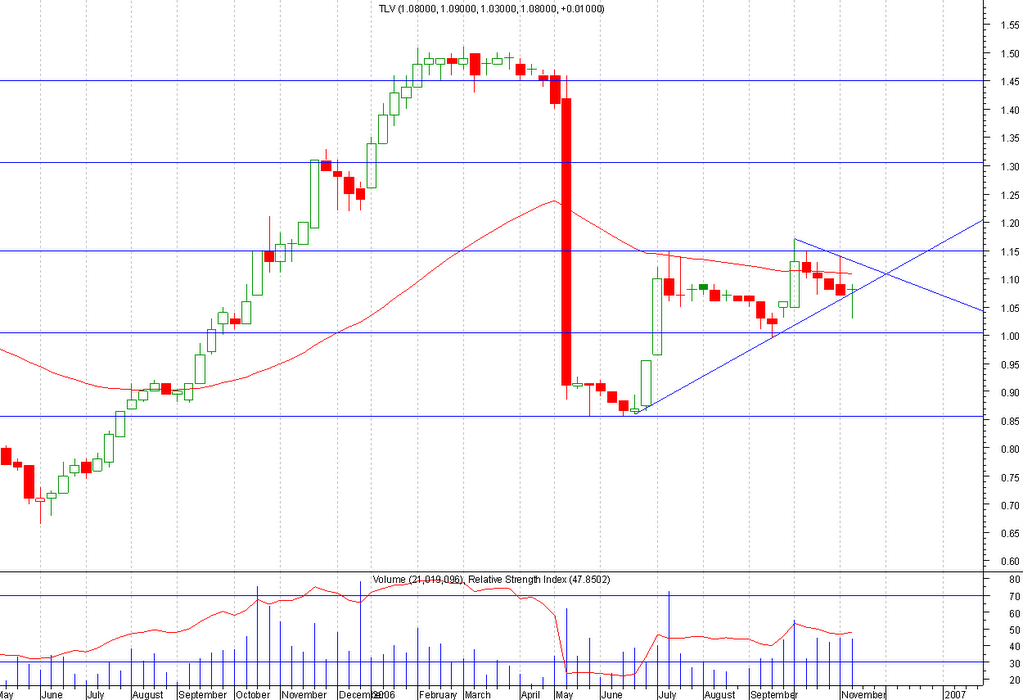
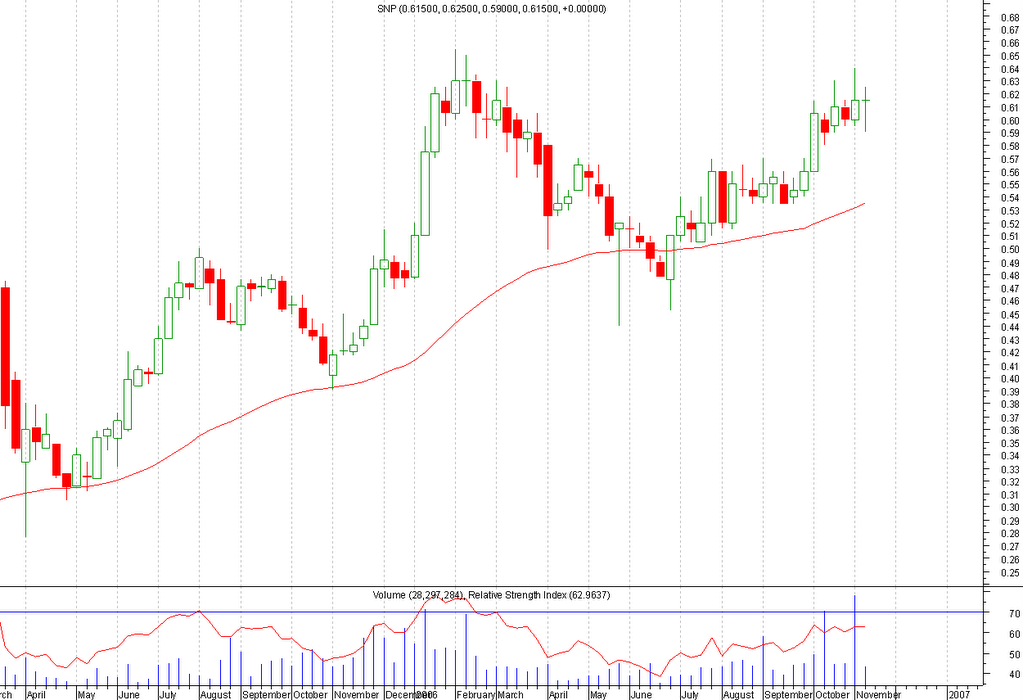
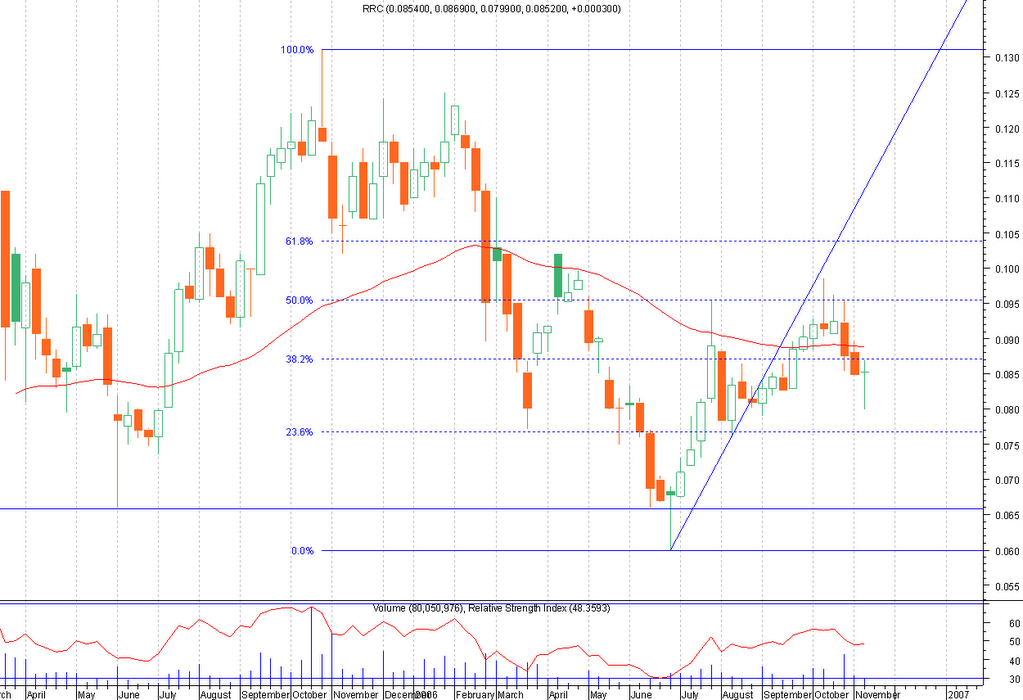
Mai sus avem graficele saptamanale ale BRD, TLV, SNP si RRC, actiuni care au impreuna o pondere de 75% din indicele BET. Se observa ca toate cele patru au inchis ultima saptamana indecis la acelasi pret la care au deschis-o. In acelasi timp lumanarile corespunzatoare ulimei saptamani au in toate cele patru cazuri cozi lungi care semnifica incapacitatea pretului de a se mentine la niveluri inferioare pretului de deschidere al saptamanii trecute.
In cazul TLV si RRC, aceasta inchidere saptamanala vine dupa cateva inchideri saptamanale pe minus, putand astfel constitui un semnal de intoarcere sau de "reversal". In cazul BRD si SNP, acest semnal de "reversal" este destul de slab, neexistand un trend saptamanal descendent anterior clar. Cu toate acestea, coada lunga a lumanarilor saptamanale reprezinta un refuz violent al pietei de a tranzactiona la preturi mai mici decat pretul de deschidere si inchidere si deci poate fi considerat un semnal de cumparare.

Graficul zilnic de mai sus al indicelui BET arata ca strapungerea liniei de trend ascendent ce venea din luna iunie de la minimele anului a avut o continuare violenta in jos trecand si prin media mobila de 50 de zile, medie insa care putem considera c-a fost doar intepata, indicele revenind imediat inapoi peste aceasta. Aceasta revenire, coroborata cu o valoare foarte scazuta a indicatorului RSI si cu inchiderile saptamanale ale actiunilor care au o pondere de 75% din indice, inchideri care se pot constitui in semnale de cumparare, dupa cum am vazut mai sus, ne pot face sa credem ca exista o probabilitate mai mare ca saptamana viitoare sa aduca cresteri (consistente chiar) ale indicelui BET si ale celor patru titluri componente despre care am vorbit. Sa speram deci ca piata va confirma!:)
FX Observations..
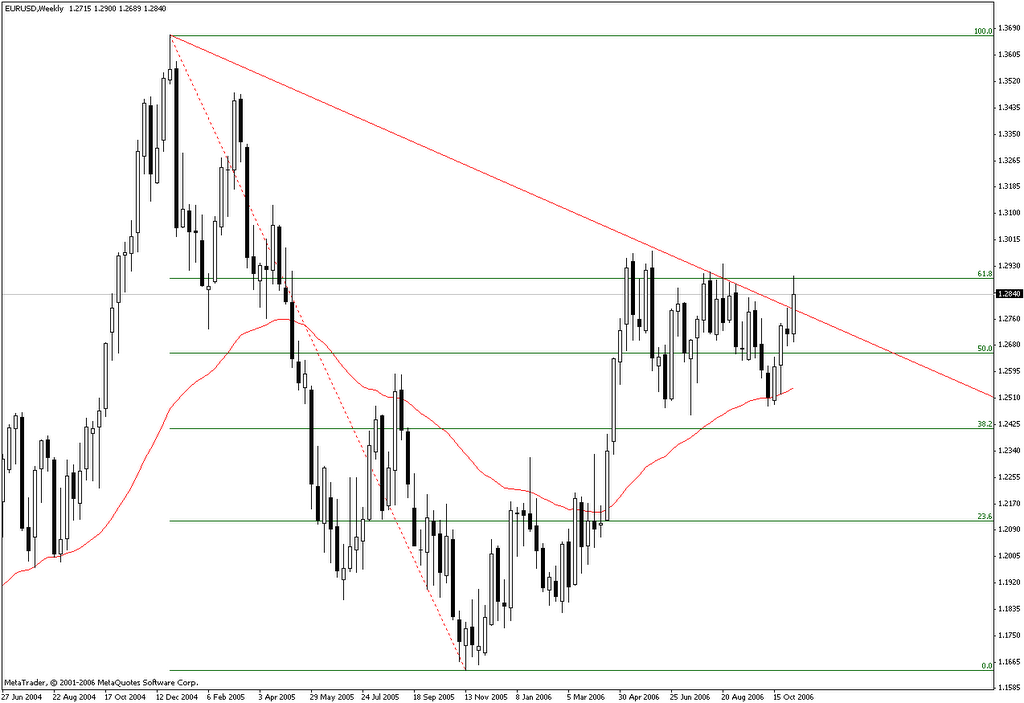
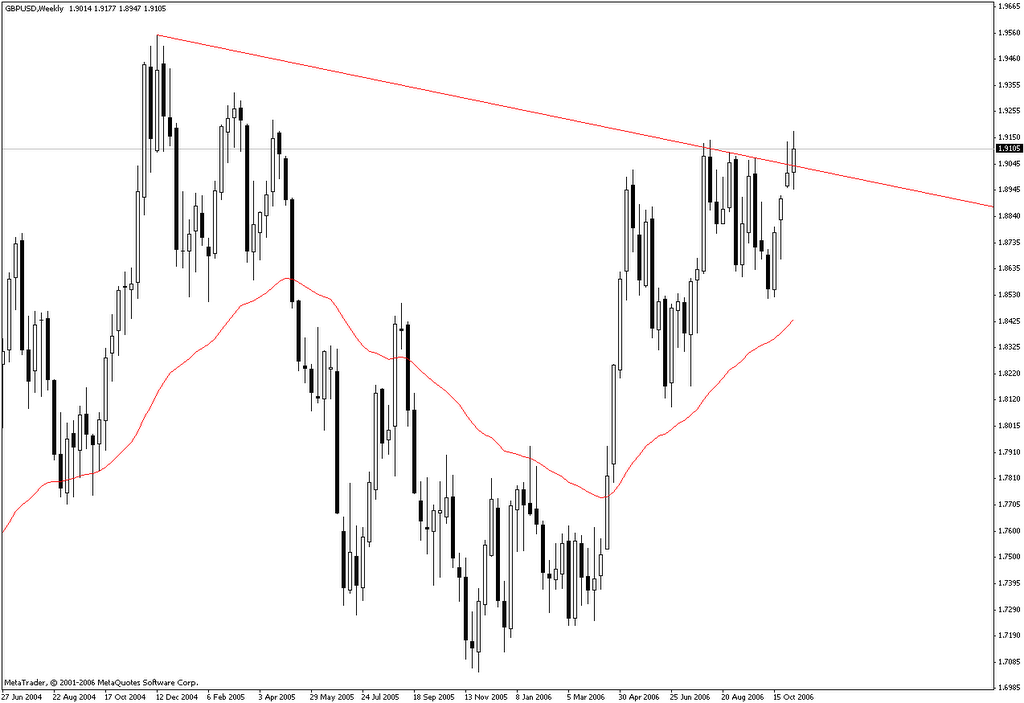
Both EURUSD and GBPUSD broke an important trend line coming from the highs of the end of 2004 and closed the week above it signaling more strength to come. Still, EURUSD couldn't overcome the 61.8% Fibonacci retracement of the 1.3665 - 1.1640 trip just yet.
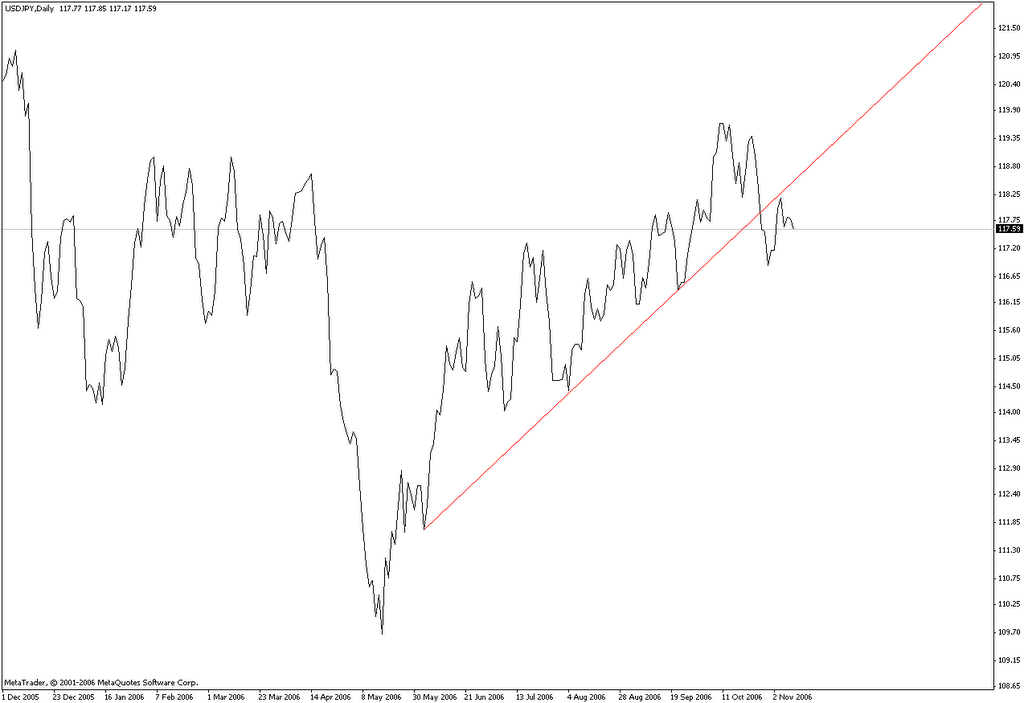
Supporting further dollar weakness we have the USDJPY daily chart above which broke the drawn bullish trend line and then tested it and failed, thus resuming the downtrend and giving scope for renewed downside potential.
DESIF2 MAR07 & DESIF5 MAR07 Targets
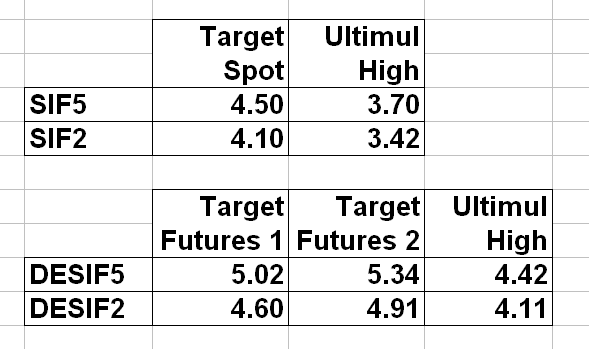
In doua posturi trecute calculam potentiale tinte de pret pentru SIF2 si SIF5. Am ales nivelul superior al zonelor de rezistenta pentru SIF2 si SIF5 (4.10 si 4.50) pentru a le folosi in calculul tintelor de pret pentru DESIF2 MAR07 si DESIF5 MAR07.
Astfel, la cele doua tinte calculate pentru piata spot am adaugat media diferentei zilnice dintre pretul futures si pretul spot de inchidere (basis-ul) de la inceputul lunii octombrie si pana pe 10 noiembrie (0.4953 pt.SIF2 si 0.5238 pt.SIF5) obtinand "Target Futures 1" din tabelul de mai sus. "Target Futures 2" l-am calculat adaugand la tintele de pret de pe piata spot basis-ul maxim obtinut (0.8050 pt.SIF2 si 0.8420 pt.SIF5) in acelasi interval (2/10 - 10/11). De remarcat insa (in tabelul de mai jos) este faptul ca atat media basis-urilor cat si maximul basis-urilor din octombrie 2005 pana in martie 2006 pentru scadenta MAR06 la DESIF2 si DESIF5 sunt de aproximativ doua ori mai mici decat datele pe care le avem pana acum pentru MAR07.

Sunday, November 05, 2006
Gold becomes bullish
Gold managed to break the line in the sand together with an important bearish trend line coming from the heights of May. The latest release of the COT report (below) shows that we may have a bottom in place because the net short commercial traders positions increased while gold rallied. Therefore, gold looks very bullish at the moment.
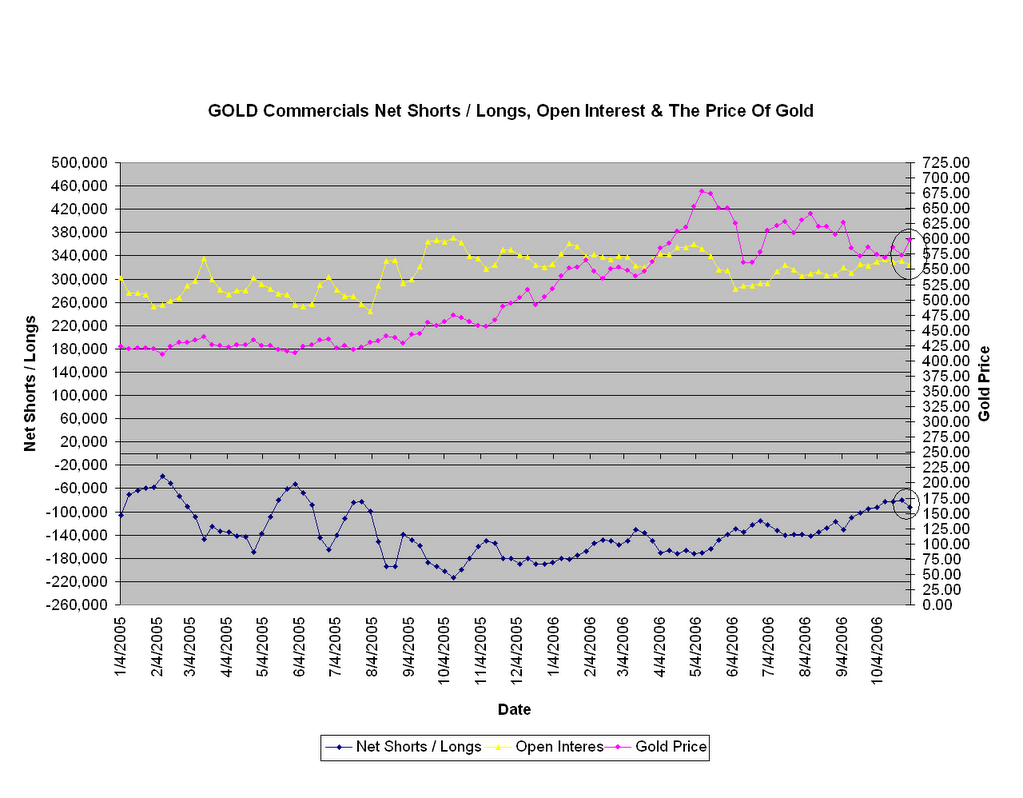
Still, we have the same warning sign I wrote about before: the open interest which is easily falling while gold rallies. If we are to see a strong bullish trend ahead, we should have an increase in the open interest as well, which means opening more long positions (more bullish confident traders) accompanying the rise in gold price.
Nevertheless, the technical setup is bullish and the first target (almost reached) is around 630 where we have the 61.8% Fibonacci retracement of the last sell off (676 - 559). Only after this resistance is fully breached, the next target becomes the full retracement back towards 675 - 676. The last resistance 600 now should become support.
Chart of the Day - TLV

TLV scapa sub suportul reprezentat de media mobila de 50 zile. Urmatorul prag se afla aproape, la 1.05 - 1.06 unde trec o linie de trend ce vine din iunie si ultima retragere Fibonacci (61.8%) a cursei de la 0.9950 - 1.1700. Daca si acest suport va ceda, TLV se va putea intoarce la 1, dar incursiunea probabil va fi de scurta durata.
Thursday, November 02, 2006
The eighth wonder of our world..
I don't know what the seven wonders of the world are, but I do know the eighth - compound interest.
Baron Rothschild
Source:
Trading Quotes
Wednesday, November 01, 2006
BET-C Proiectie
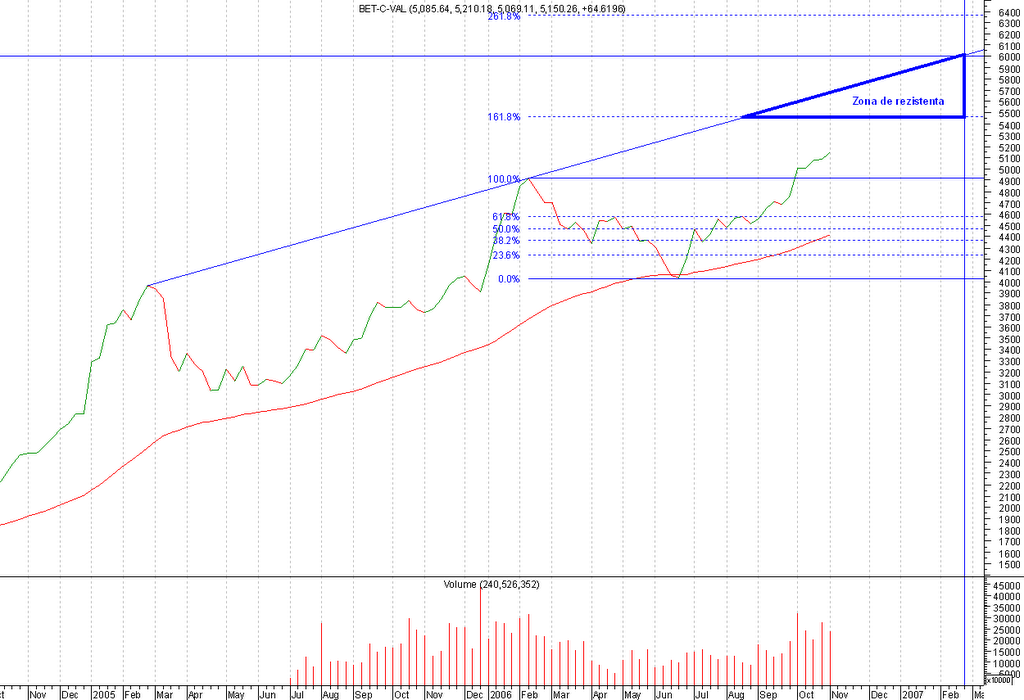
Pentru BET-C targetul poate fi intre 5500 si 6000 de puncte pana la sfarsitul lui februarie 2007. Dupa cum observam in graficul de mai jos, rezistenta transformata in suport sprijina trendul crescator al acestui indice si practic al intregii piete bursiere romanesti.

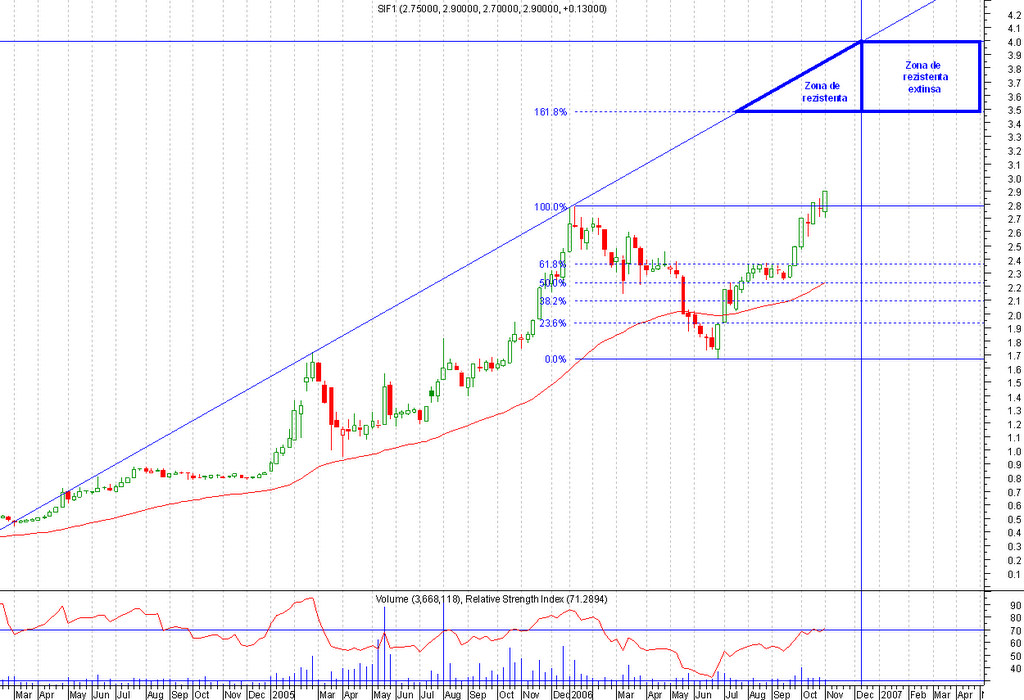
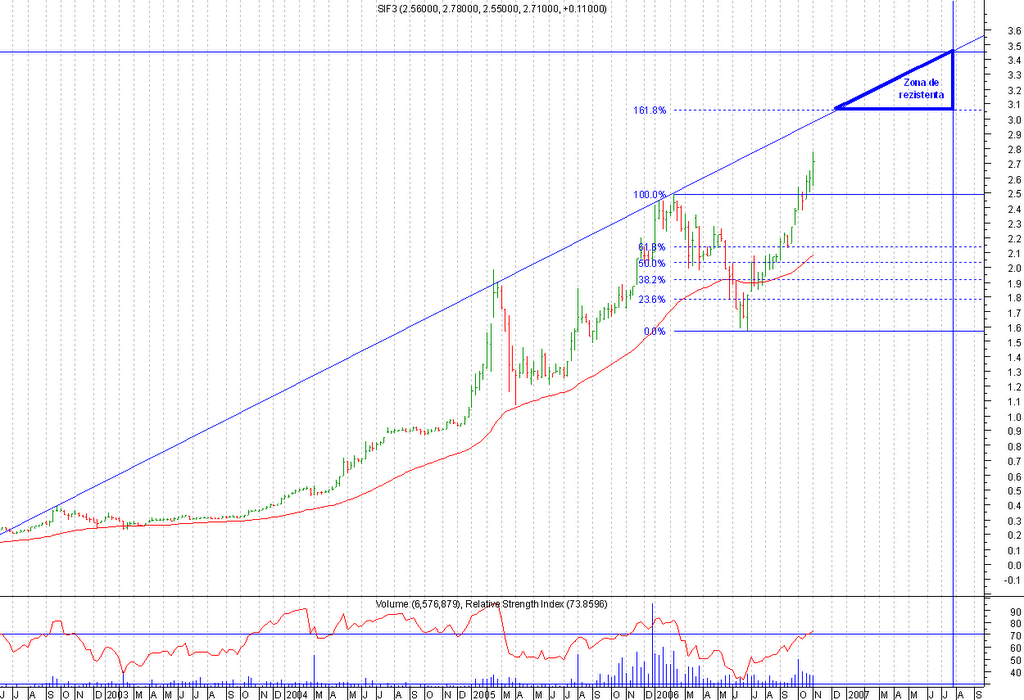
SIF1 & SIF3 Price Targets
Folosind aceleasi reguli simple de proiectie ca in cazul SIF2, SIF5 sau BET-FI, identificam pentru SIF1 o zona de rezistenta intre 3.5 si 4.0 care ar putea sa-i opreasca ascensiunea undeva spre sfarsitul anului si inceputul anului viitor.
Conform desenului, SIF3 pare sa-si prelungeasca ascensiunea pana in vara anului viitor iar zona de rezistenta se afla intre 3.05 si 3.45. Mai probabil este insa ca topurile pe termen mediu sa fie facute la inceputul anului viitor undeva in zona de rezistenta.
Subscribe to:
Posts (Atom)