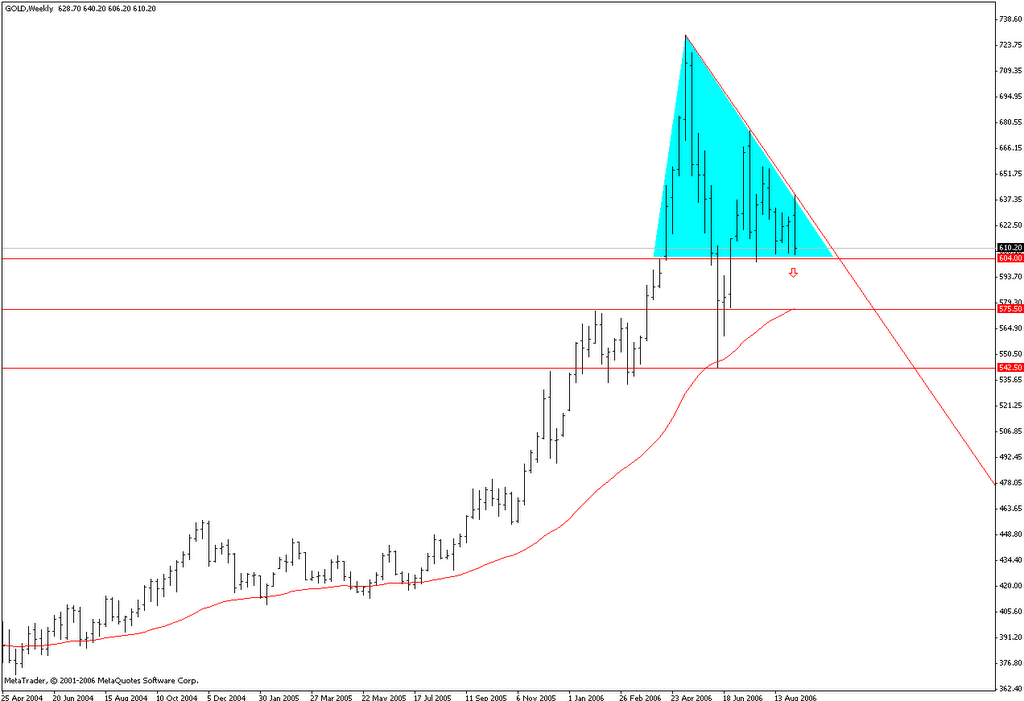
In the beginning of last week gold performed a nice fake breakout of the daily downtrend line and then swiftly dropped again towards the support around 600, being the fourth test so far. As it can be noticed in the gold weekly chart above, most of the price action tends to be confined into a triangle with a flat side towards 600.
Since the triangle is almost full, it will be broken soon, but in which direction?
It is said that triangles may mean either accumulation or distribution, but they are usually broken on the flat side. Therefore, we might see another corrective downtrend in gold. If it happens, gold could drop through 600, stumble over 575 support and if it cannot recover, may continue towards 540's again where we have the last corrective minimum and 38.2% Fibonacci retracement of the impressive gold rally which started in 2001 when the price was around 250's. At 540's, the 50% retracement at 490 is in sight but right now it is a bit overstretched.
To support the downward breakout, here are two weekly charts of the CRB Index and Crude Oil October futures contract.
The CRB Index is a basket of various commodities (metals, textiles, fats and oils, livestock, raw industrials ad foodstuffs) which had a strong rally during the last few years. Two weeks ago, an important upward trendline was broken and it looks to be the start of a larger corrective movement.

Crude Oil dropped sharply through 70 and through a multiyear upward trendline and it also looks to start a larger corrective movement. An OPEC meeting begins on Monday and this might strengthen the correction.
Gold is a commodity as well, and it's part of the CRB Index, too..therefore why shouldn't it follow the same corrective trend? We'll see..
No comments:
Post a Comment