Friday, September 29, 2006

In 2006 Dow Jones is testing the 2000 highs..for the first time!

"..(on Wednesday) only 10 of the 30 Dow components were above their 2000 highs. Four stocks -- Boeing, United Tech, Caterpillar and Altria -- were the primary drivers, pulling the Dow higher despite the drag of so many other relatively weak components. 15 of the 20 Dow stocks still below their prior highs are down substantially, with GM and Intel off ~60%, and Microsoft still down by 51%, and Home Depot and Merck off ~ 40%.

Consider what happened if you actually held these 30 stocks (individual issues or through the Diamonds) since January 2000: After 6 1/2 years, you are now almost breakeven on a nominal basis. If you reinvested the dividends from the Dow, you would be up 12.7%.

On a real basis, adjusted for inflation, you are actually down 19%; With reinvested dividends, you are down around 9%.

If you were lucky enough to sell back in January 2000, and you instead simply placed the money in a cash fund (money market), you would be up ~20.87% on a nominal basis; On a real basis, you are up just under 2%."

During the same period of time (2000 - today), the Bucharest Stock Exchange Index (BET) rose by more than 5 times (adjusted for inflation)! Here's something we do beat the americans!:))

Sources:

Thursday, September 28, 2006

Quote of the Day

The market can stay irrational longer than you can stay solvent.

John Maynard Keynes

Wondering why GBP is soft..?

Check this out..

"The Office for National Statistics on Wednesday admitted to an error that dramatically reduced the worry over inflation in the economy and makes a further interest rate rise less likely. The ONS slashed its estimate of annual inflation in export prices from 3.8 to 0.6 per cent after it found it had introduced an error into the calculation."

If long GBP..that's a good reason to kill a statistician..:))

Sources:
ERROR MAKES UK RATE RISE LESS LIKELY By Chris Giles, Economics Editor
and FXstreet.com Weblog

Wednesday, September 27, 2006

US Inverted Yield Curve

It seems that bond traders have a gloomy near future American economic outlook. The yields of the long term treasury bonds have dropped sharply lately and the yield curve has been inverted for some time. This means the long term (10 or 30 year) Treasury note yields fell below the shorter term Treasury bonds and Federal Reserve discount rate (at 5.25%) and when this happens, economists say the yield curve is inverted and they forecast recession in the following months. The rationale behind it is related to the behavior of investors who buy more long term bonds than short term ones, thus securing good coupon rates in the long run, while they predict a difficult economic period ahead which might force cutting interest rates in the short run and reduce their potential gain on both long and short term future newly issued bonds. Since bond prices and bond yields are inversely related, when investors buy more long term bonds, their prices rise and their yields fall, as we notice in the charts below:


Above is the chart of the 10 Year Treasury Note and bellow is the chart of the 10 Year Treasury Note Yield (now at around 4.6%).


Therefore, the inverted yield curve predicts recession ahead (as it predicted several times in the American economic history, including in 2000). Nevertheless, the stock market in US is making new highs, approaching the historical year 2000 highs and the dollar is stubbornly strong compared to several months ago (though we cannot ignore the fundamental positive interest rate differential especially against EUR or JPY). Economists say the same happened in 2000 before the recession and this time can’t be different. What’s obvious, though, is the slowing of the American economy (and especially the housing market) which is actually normal due to the high interest rates the FED has arrived at after a strong and measured two year rally. That’s why, at some point, I believe this economic slowdown will also be reflected in the financial markets, (following the commodity markets where this slowdown has already been reflected).

Tuesday, September 26, 2006

Why is Oil Dropping?

Six reasons why Oil si dropping in Barry Ritholtz's view:

1. Fast money rotating out of commodities and into tech;
2. Cooling economy consuming less energy;
3. No major supply disruption from weather or Middle East;
4. Psychology peaked earlier in year;
5. Stretched consumer shifts behavior;
6. And lastly, the Strong US Dollar (Crude is priced in greenbacks)

Source:
Why is Oil Dropping (and what might its impact be)?
Barry Ritholtz - The Big Picture

Monday, September 25, 2006

Prevestitorii primaverii..

Iata doua categorii de semne care pot prevesti revenirea primaverii pe bursa romaneasca din toamna.

Prima categorie include un grup de actiuni mai rar bagate in seama in general de investitori, dar care de la inceputul saptamanii trecute si pana vineri sau astazi au inviat pe volume mari si cresteri pe masura. Astfel, ZIM (+9.62%), ART (+7.65%), CBC (+11.19%), VEL (+4.24%), VNC (+6.52%), CRB (+12.75%), CMP (+5.76%) sau AMO (+4.36%) au adus randamente neobisnuite saptamana trecuta. Probabil ca investitorii dupa ce s-au burdusit cu blue chipsuri si-au indreptat atentia si asupra acestei categorii de actiuni sa-i zicem "small cap" care este destul de neglijata de obicei.

A doua categorie se refera la raportul PUT/CALL despre care am mai discutat acum aproape doua saptamani si care prevestea din a doua jumatate a lunii august ca se asteapta o perioada de scadere a pietei. Iata ca trendul raportului pornit atunci se intoarce acum si anunta revenirea cresterilor.


In graficul de mai sus observam ca Open Interest-ul optiunilor CALL a crescut foarte mult in ultima perioada in timp ce Open Interest-ul optiunilor PUT a ramas constant, determinand trendul raportului PUT/CALL pe Open Interest sa se intoarca.


La fel, mai sus se observa ca volumele tranzactionate cu optiuni CALL au depasit pe cele cu optiuni PUT (iar raportul PUT/CALL a devenit subunitar).
Aceste inversari de trend ale raportului PUT/CALL dau semnele unei reveniri a pietei (sau cel putin a acelor emitenti pe ale caror derivate se tranzactioneaza optiuni). In cazul SIFurilor, este deja evidenta astazi revenirea (BET-FI facand noi maxime), dar important va fi sa urmarim trendul acestor raporturi in perioada urmatoare pentru confirmarea reluarii cresterilor sustinute.

Valutele in miscare

In ultimele zile necazurile forintului ungar s-au revarsat si asupra altor monede din regiune, inclusiv asupra leului nostru. Si iata-l ca s-a miscat bine, fata de euro si dollar.
Daca anumite reguli de analiza tehnica s-ar verifica (vezi graficele de mai jos), EURRONul ar putea urca pana la 3.6 in perioada urmatoare (suport/rezistenta puternice + downtrend de la inceputul anului) , daca nu cade sub 3.53 (media mobila exponentiala de 50 zile).


La fel USDRONul pare sa fie intre un downtrend de la inceputul anului si EMA50 de unde cand va scapa probabil ca va zburda. Vom vedea.


Steve Jobs introduces Macintosh in 1984


On the 3rd of January 1984, Steve Jobs introduced Macintosh. It was only 22 years ago, damn it..!:)

Sunday, September 24, 2006

Cati bani poate inghiti zilnic bursa de la Sibiu?

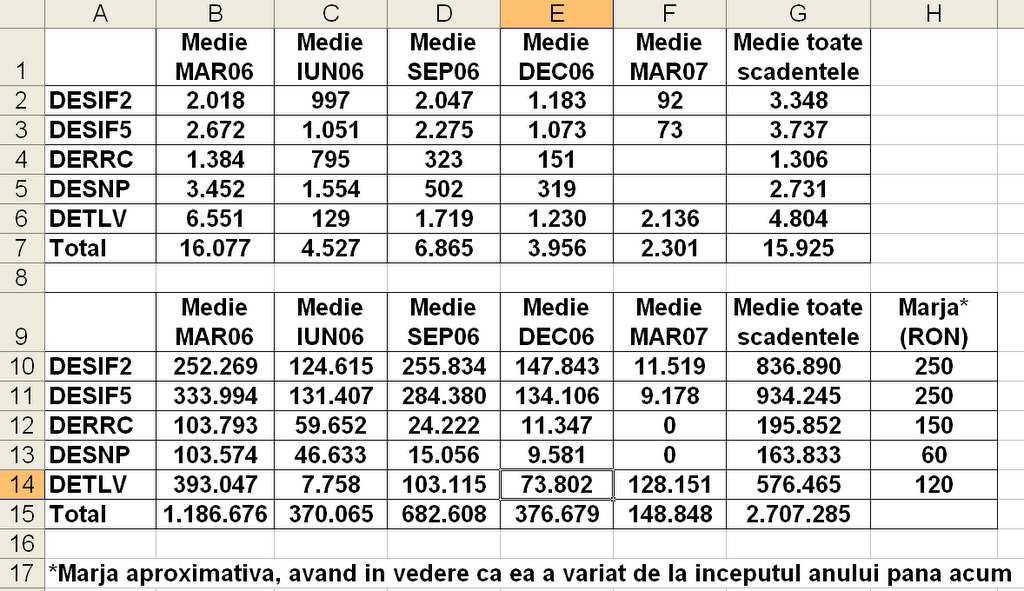
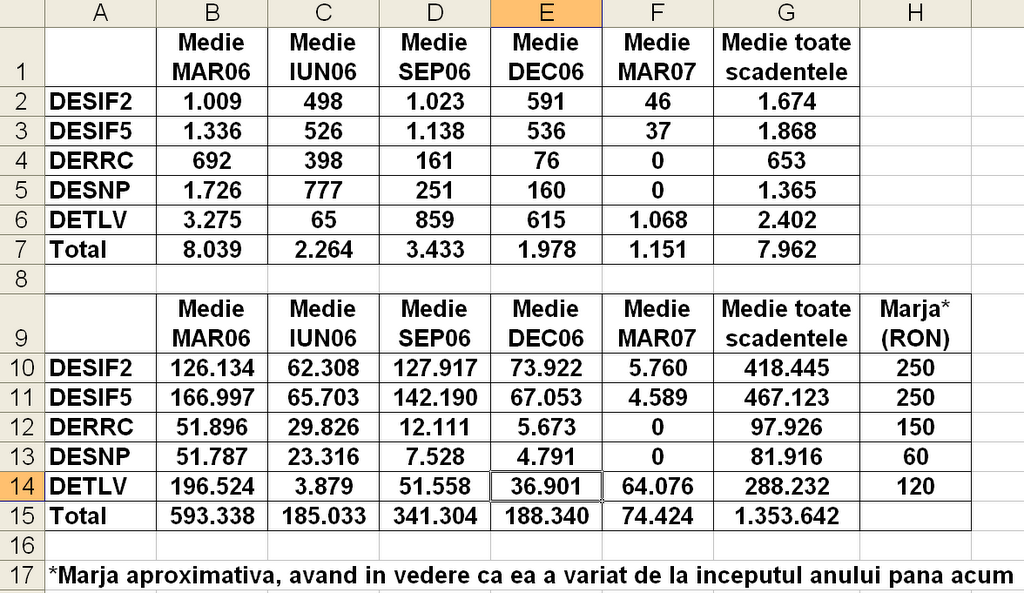
Daca am avea un investitor cu multi bani care doreste sa cumpere sau sa vanda contracte la bursa de la Sibiu intr-o zi, oare cate contracte ar putea achizitiona si ce sume s-ar imobiliza pentru marja? Iata un calcul pe care l-am facut..o aproximare pe baza istoricului a cinci derivate (cele mai lichide) pe toate scadentele disponibile (cu exceptia IUN07, foarte putin lichida) de la inceputul anului si pana vineri, 22 septembrie. Aproximarea este foarte "aproximativa" dar sper ca ofera o imagine a largimii acestei piete.

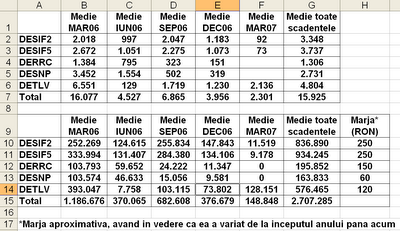
In tabelul de mai sus se gasesc mediile zilnice a cinci scadente disponibile (MAR06, IUN06, SEP06, DEC06, MAR07) pentru cele mai lichide cinci derivate (DESIF2, DESIF5, DERRC, DESNP, DETLV) de la inceputul anului si pana vineri, 22 septembrie 2006. De asemena exista si o medie zilnica a tuturor scadentelor disponibile la un moment dat pentru un contract anume (cap tabel "Medie toate scadentele"). Deoarece tranzactionarea pe piata futures este un "zero-sum game" iar numarul contractelor cumparate trebuie sa fie egal cu numarul celor vandute, si invers, mediile de mai sus le impart la doi in tabelul de mai jos.

Prin urmare, putem spune ca cineva interesat sa cumpere sau sa vanda intr-o zi unul din cele cinci derivate, indiferent de pret, este limitat (in medie) la numarul de contracte din tabelul de mai sus, pe fiecare scadenta disponibila sau pe toate scadentele disponibile in acea zi (sigur cu rezerva ca este putin probabil ca un singur investitor sa cumpere/vanda singur toata media).

De exemplu, intr-o zi am putea cumpara sau vinde in medie 1.365 contracte DESNP la o marja de 60 RON in valoare de 81.916 RON pe trei scadente (SEP06, DEC06, MAR07). Sau am fi putut cumpara sau vinde in medie pe zi 1.336 contracte DESIF5 la o marja de 250 RON pe scadenta MAR06 in valoare de 166.997 RON. La fel am putea cumpara sau vinde in medie pe zi 615 contracte DETLV DEC06 in valoare de 36.901 RON la o marja de 120 RON.

Se observa ca pe cele mai lichide cinci derivate si pe toate scadentele disponibile la un moment dat, s-ar putea imobiliza in medie zilnic marje de peste 400.000 RON (in cazul ambelor SIFurilor), de aproape 300.000 RON (pentru DETLV) si de aproape 100.000 RON (in cazul DESNP si DERRC).

Repet, calculul este grosier si aproximativ, dar cred ca nu este departe de adevar si de largimea reala a pietei derivatelor de la Sibiu, putand fi de folos investitorilor mari ce doresc sa initieze operatiuni de hedging, arbitraj, spreaduri sau simple pozitii de long sau short. Si avand in vedere ca piata derivatelor este in crestere exponentiala, si mediile de mai sus vor fi intr-o crestere continua.

Wednesday, September 20, 2006

The Illusory World of Economic Forecasting

"William Sherden did research on the accuracy of leading forecasters over a few decades, and his findings were summarized in his book "The Fortune Sellers: The Big Business of Buying and Selling Predictions." And his conclusions are still accurate:
"They are timeless. The political influence on predictions is basic human nature. I see no way that economic forecasting can improve since it is trying to do the impossible."

Here are Sherden's top 10 findings in The Fortune Sellers:
1. The forecasting skill of economists is on average about as good as guessing. In fact, predictions by the politically driven Council of Economic Advisors, Federal Reserve Board and Congressional Budget Office were often worse than guessing.
2. Economists cannot predict the turning points in the economy. Of 48 predictions made by economists, 46 missed the turning points.
3. Economic forecasting accuracy declines with longer lead times.
4. No economic forecasters consistently lead the pack in accuracy.
5. No economic ideology consistently produces superior forecasts.
6. No economic forecaster has consistently higher forecasting skills predicting any particular economic statistic.
7. Consensus forecasts do not improve accuracy (although the press loves them).
8. Psychological bias affects forecasters and their forecasts. Some economists are naturally optimistic and bullish, others are consistently pessimistic bears.
9. Increased sophistication provides no improvement in forecasting accuracy. Remember the Long-Term Capital Management hedge fund? Two brilliant Nobel Economists backed by Wall Street's elite nearly sabotaged the world economy.
10. Finally, Sherden says there's no evidence that economic forecasting has improved in recent decades. In fact, forecasting appears to be deteriorating as partisan politics, Wall Street gaming and unpredictable global events invent new illusions."

Therefore..always bet against the forecasters!:)

Source:
The Big Picture

Monday, September 18, 2006

Chart of the Day - SNP


SNPul pare ca sta sa cada prin trendline dupa un dublu top la 0.57 si inainte de retragerea Fibonacci de 61.8%.. urmatorul suport ar fi pe la 0.50 - 0.51.. si avand in vedere ca se anunta curand si detaliile vanzarii de actiuni la salariati.. ar fi toate sansele..

Saturday, September 16, 2006

Commodities grow cheaper


The CRB Index fell heavily along with Oil this week. Gold followed them sharply as I was expecting. The metal broke a triangle formation and fell through the 200-day moving average, as well, this week. As noted below, it ended the week below the 200-day MA but above 50-week EMA. Unless a strong rebound above 600 happens next week, I think Gold is gonna continue it's downward journey towards the next support which should be around $540 (38.2% Fibonacci retracement and a previous low).


These developments in the commodity markets start to look worrying as they may mean a global slowdown. Barry Ritholtz from The Big Picture puts it best:
"My largest present concern is oil and other commodity prices. It's no coincidence that gas, oil, gold, aluminum and copper all have dropped at the same time. I read that as signs of a global slowing in demand."

Difficult weekend for the yen

This weekend, the G7 finance ministers meet in Singapore where they might discuss the latest weakness in the Japanese currency. Last April (on Easter weekend in Romania), the G7 officials urged countries with large trade surpluses (notably China and Japan) to let their currencies rise. As a result, the USDYEN plunged 900 pips, a roughly 2% appreciation for the yen. Will it happen the same or the opposite this time? We'll see..

What's interesting is the situation of the commitment of traders in the futures markets in the US regarding the yen.


As we notice in the chart above, on Tuesday this week (when the numbers are reported), the commercials were at historical extreme net longs while the open interest is the highest ever. This means that the commercials (futures market participants that hedge their commercial exposure on the Japanese currency) expect the Yen to depreciate even more, though the extreme levels require cautiousness because the whole picture can change radically until next Tuesday following this weekend G7 meeting.

The Economic / Market Cycle in US


Original Source: Matt Blackman, the EquiTrend Weekly Market Watch
Where is US in this at the moment, because it's damn hell of important for the whole world!:) John Mauldin in his weekly newsletter says we are at 3 o'clock!

Source:
John MauldinThoughts from the Frontline, September 15, 2006

Friday, September 15, 2006

Chart of the Day - BRD - Spectacol!:)


Dupa un triplu test al retragerii Fibonacci de 61.8% (aflata la 17.7) la inceputul lui august, BRD s-a corectat pana la retragerea Fibonacci de 50% si media mobila de 50 zile (aflate la 16.9 - 17) si a consolidat in intervalul 16.9 - 17.7 pana astazi, cand a intervenit un breakout nervos sustinut probabil si de cumparatori mari sau stiri (inside information?!) care nu sunt inca publice.

Iata mai jos un chart intraday al evolutiei pretului BRD de astazi.


Ieri maximul fusese la 17.6, deci foarte aproape de rezistenta puternica de la 17.7. Astazi se deschide la 17.5 si pana la 10.59 (se pare ca traderul era emotionat si a tras cortina pentru a incepe spectacolul cu un minut inainte) pretul ramane neschimbat, cand dintr-o data se intensifica numarul tranzactiilor si volumul schimbat, ducand pretul brusc la 17.7. Rezistenta nu cedeaza cu una cu doua, in ciuda intepaturilor la 17.8 si pretul se retrage pana la ora 12 la 17.6. In urmatoarea jumatate de ora volumele si tranzactiile se intensifica din nou si in urma acestui atac, reduta 17.7 cedeaza definitiv, pretul stabilizandu-se la 17.9.
La 13:08 un nou tavalug de tranzactii si volume ridicate (35.000 actiuni intr-un minut) duce pretul la 18, dar se intoarce imediat la 17.9. La 13:33 se fac tranzactii multe si volume in crestere la 18 iar la 13:40 incepe nebunia. Pragul psihologic de 18 este trecut pe fondul unui numar mare de tranzactii dar pe volume mici (pare-se ca multimea a inceput sa sara in caruta vazand caii la trap in aceiasi directie fara a da semne ca vor sa incetineasca). La 13:58 si 13:59, volumele cresc brusc (alt trader sau acelasi trader emotionat), la fel si tranzactiile, schimbandu-se 17% din volumul intregii zile si ducand pretul la 18.5.
In urmatoarele 15 minute pana la inchiderea sedintei, euforia nu mai cunoaste margini, facandu-se schimburi de peste 500.000 de actiuni in peste 250 de tranzactii reprezentand 65% din volumul zilei si respectiv 43% din tranzactiile zilei, pretul explodand pana la 19.5 (intamplator sau nu chiar pana la o linie de uptrend sparta in trecut in urma triplului test la 17.7 si aflata astazi la 19.5), el practic neavand niciun alt obstacol semnificativ pana la maximul istoric de 20 in urma caderii redutei retragerii Fibonacci de 61.8% de la 17.7.

Tehnic, aceasta evolutie a BRD era de asteptat, dar intensitatea cu care s-a manifestat este remarcabila. In mod normal, BRDul ar trebui sa se retraga pana la cel mult 17.7 (fosta rezistenta devenita suport) si apoi, cu forte refacute sa atace pragul istoric si psihologic de 20, asta daca nu o va face deja de luni, ca inertie a euforiei de astazi. Iar atunci cand va reusi sa doboare reduta 20, pentru anul viitor, tinta e 25-26.

Wednesday, September 13, 2006

Raportul PUT/CALL si sentimentul pietei

Piata noastra spot de actiuni a intrat intr-o perioada de letargie cu tendinte vizibile de scadere, chiar daca grafic, nu pare sa fie altceva decat o consolidare insotita de gatuirea benzilor Bollinger (in cazul BET) sau o corectie necesara (in cazul BET-FI) inainte de o noua runda de cresteri.

Piata derivatelor de la Sibiu, insa, mai ales dupa scaderile "generoase" de astazi arata mai degraba o intensificare (ca volum si interes) a conturarii unui downtrend. Nu numai inchiderile pe derivatele futures ale SIF5, SIF2, TLV sau SNP arata acest lucru, dar si un indicator des folosit in pietele dezvolate de derivate, care insa la noi poate fi inselator din cauza lipsei unei lichiditati suficiente..raportul PUT/CALL.

Menirea lui este aceea de a estima sentimentul mai bearish sau mai bullish al celor care tranzactioneaza (si) optiuni. Raportul se face de obicei intre volumul de tranzactionare zilnic cu puturi si cel cu calluri. Astfel, un raport in crestere arata ca exista mai multe optiuni put tranzactionate decat call si deci un interes mai mare pentru niste instrumente care genereaza profit din scaderile pietei ceea ce scoate in evidenta asteptarile investitorilor ca preturile vor scadea. Iata mai jos evolutia grafica a acestui raport pe piata de la Sibiu.


Se observa ca de la sfarsitul lui august volumele de tranzactionare ale optiunilor put s-au intensificat in raport cu cele ale optiunilor call (dupa trendul ascendend al raportului). In acelasi timp open interest-ul pe put a crescut constant, spre deosebire de cel pe call care a fost oscilant.

Raportul PUT/CALL poate fi facut si la nivel de open interest si iata rezultatul in graficul de mai jos.


Se vede ca sfarsitul de august a adus o crestere accentuata a open interestului pe put si o scadere a celui pe call, impregnand o evolutie ascendenta abrupta a raportului dintre ele.

Asadar cele doua grafice ne indica faptul ca incepand cu sfarsitul de august, in timpul nebuniei pe nume Transelectrica, investitorii participanti pe piata optiunilor au inceput sa vada scaderi la bursa si nu cresteri! Confirmarile acestor scaderi par sa vina zilele acestea, atat pe piata futures cat si pe stock (mai ales SIFurile). Iar trendul ar putea continua pe termen scurt.

Insa va exista probabil un moment cand open interestul pe puturi si raportul PUT/CALL vor atinge niste limite extreme (si necunoscute inca) ce vor determina intoarcerea trendului ascendent. Reintoarcerea la aceste limite va fi interesant de urmarit in viitor cand situatia se va repeta.

Chiar daca o medie zilnica de numai 65 de contracte PUT nu este foarte incurajatoare pentru a valida cu incredere rezultatele analizei de mai sus, cred ca se poate totusi extrage o tendinta la nivel de asteptari a investitorilor pe piata de optiuni, investitori care banuiesc in mare parte sunt buni cunoscatori ai pietei, dat fiind complexitatea acestor instruimente. Asadar ramane de urmarit daca PUT/CALL ratio poate fi folosit ca un indicator anticipativ si valabil al sentimentului de piata al investitorilor chiar si in conditiile unei lichiditati infime a pietei de optiuni cum este cea de la Sibiu.

Tuesday, September 12, 2006

Where to, Mr. Yen?

USDJPY is testing again the 8 year trendline (see the chart below). Is it ready to break it? I would say it is, because of two reasons:

1. It is still one of the best carry trades, the difference between the Bank of Japan interest rate (0.25%) and the FED rate (5.25%) being 5%. The Bank of Japan has just started to increase rates by 0.25% a couple of months ago after more than 6 years while the Fed has just stopped hiking after 17 consecutive 0.25% measured-paced increases. Still, this doesn't seem to stop investors from borrowing money at 5% discount!:)


2. The Yen is heavily sold against the Euro, while the interest rate differential is 2.75% and it's likely to see it widening since ECB is to hike more aggressively than BOJ due to inflationary pressures. Moreover, in the EURJPY monthly chart below we can notice that a 14 year trendline was vigorously broken last month and the strong bullish trend started 6 years ago still has room to run. Anyway, EURJPY had only one correction week last week following a 15 week bull run and its speed may slow a bit in the near future, but the lead in selling the Yen may be taken by USDJPY next.

Monday, September 11, 2006

Broken Triangle


Gold did break the flat side of the triangle and the follow through was pretty strong, as it usually is in these kind of technical setups. I sliced the bigger triangle (which was an imperfect one since it had been quickly broken once) into a smaller one which better reveals the technical setup.
Now it remains to be seen which of the supports will hold this correction (it is a correction, right?:)). So far, most of the markets seem to trend short term within their respective correlations..the commodities are falling (silver, copper, oil, natural gas etc.) and the dollar is strengthening. I believe this is just a corrective movement in the markets before returning to the weak dollar and strong gold theme. But the markets are always right and my belief may be wrong:))

Is gold set to drop through the 600 figure again?


In the beginning of last week gold performed a nice fake breakout of the daily downtrend line and then swiftly dropped again towards the support around 600, being the fourth test so far. As it can be noticed in the gold weekly chart above, most of the price action tends to be confined into a triangle with a flat side towards 600.

Since the triangle is almost full, it will be broken soon, but in which direction?

It is said that triangles may mean either accumulation or distribution, but they are usually broken on the flat side. Therefore, we might see another corrective downtrend in gold. If it happens, gold could drop through 600, stumble over 575 support and if it cannot recover, may continue towards 540's again where we have the last corrective minimum and 38.2% Fibonacci retracement of the impressive gold rally which started in 2001 when the price was around 250's. At 540's, the 50% retracement at 490 is in sight but right now it is a bit overstretched.

To support the downward breakout, here are two weekly charts of the CRB Index and Crude Oil October futures contract.


The CRB Index is a basket of various commodities (metals, textiles, fats and oils, livestock, raw industrials ad foodstuffs) which had a strong rally during the last few years. Two weeks ago, an important upward trendline was broken and it looks to be the start of a larger corrective movement.


Crude Oil dropped sharply through 70 and through a multiyear upward trendline and it also looks to start a larger corrective movement. An OPEC meeting begins on Monday and this might strengthen the correction.

Gold is a commodity as well, and it's part of the CRB Index, too..therefore why shouldn't it follow the same corrective trend? We'll see..