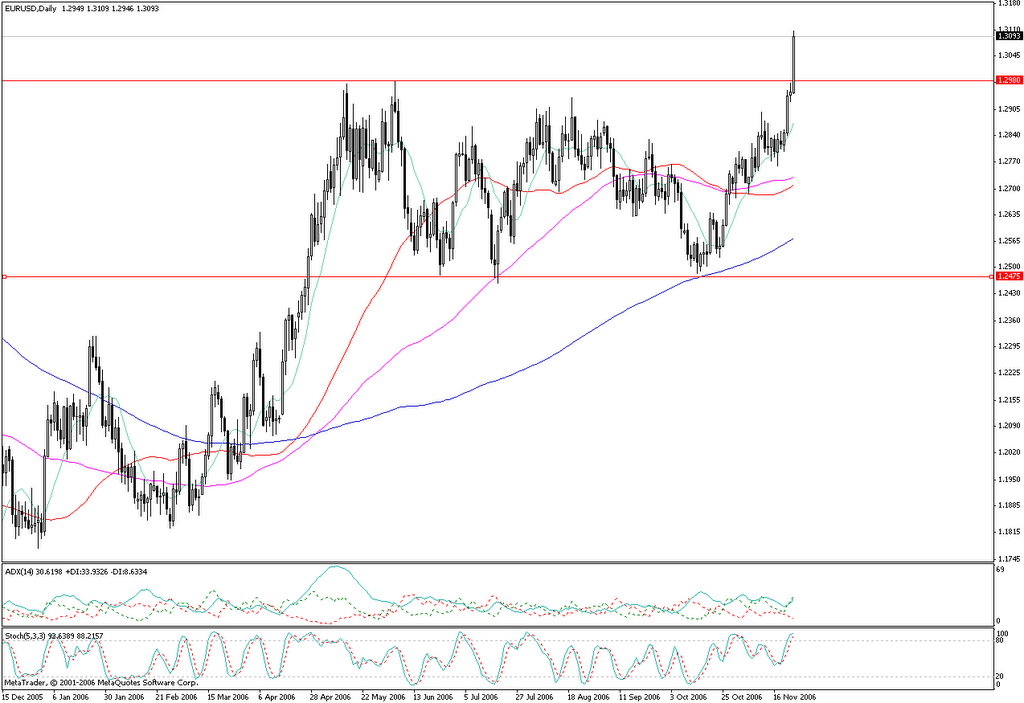
As observed in a previous post, the dollar weakness resumed and the long waited EURUSD breakout of a 6 month range and the break of an inverse head and shoulders neck eventually happened on Friday. On the daily chart above there are several technical indicators that support a continuation of the bullish trend. Apart from the breakout resistance that should become support at around 1.2980, we have a 10-day moving average at around 1.2875 which has been well tested since the end of October indicating a bullish sign and ascending support. The ADX is at trending levels (30 on Friday, a minimum of 25 is needed) with +DI furthering away from -DI and the Stochastic indicator reaches overbought levels but it prepares to stay there for a longer period of time.

On a monthly chart (above) we see that last week we had a break of the last Fibonacci retracement (61.8%) of the 1.3665 - 1.1640 trip, a break which this time was confirmed by a close above the Fibo level. This chart shows us two potential resistance levels before the last top (at 1.3665). The first one is around 1.33 (previous tops from a time when the chart was drawn using a basket of the currencies that disappeared when euro appeared in 1999) and the second one is towards 1.35 where we have a downward trend line coming from the 1995 highs.
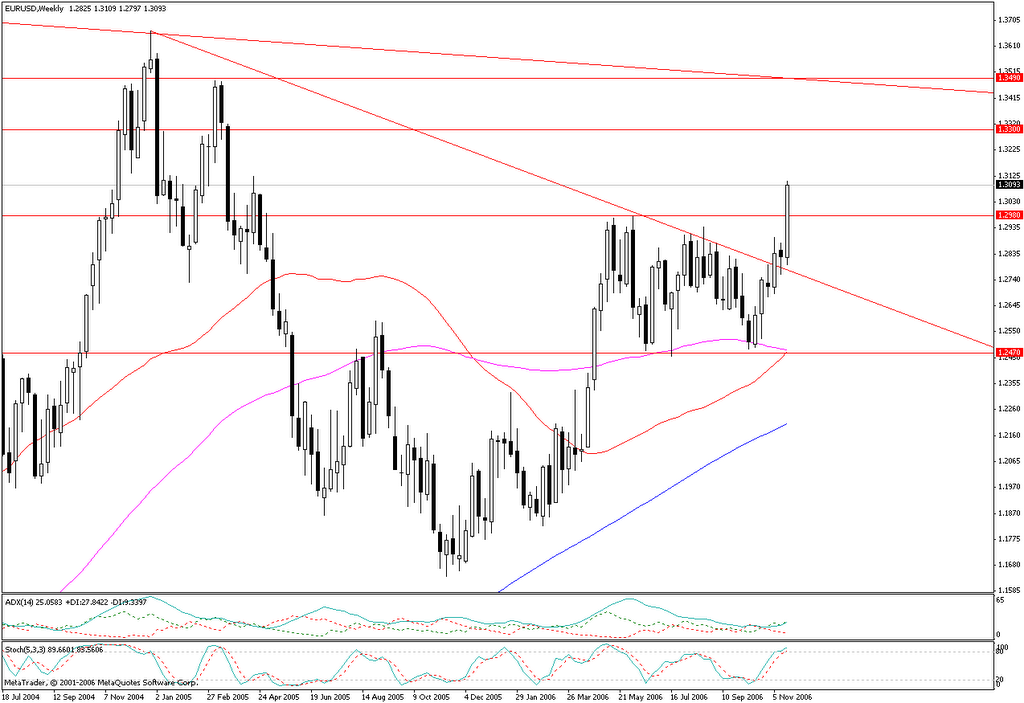
The weekly chart (above) shows us the downward trend line broken two weeks ago and the breakout of a 6-month-500-pip range. The EURUSD may run at least another 500 pips toward 1.35 where we have the 1995 started downward trend line we've seen on the monthly chart. Both ADX (25) and Stochastic are at trend ready levels but need confirmation. The same is true for the 50 day moving average which is about to cross the 100 day moving average. Since these crosses are lagging indicators of a trend, we can only imagine that we have a continuation of the bullish trend which will be confirmed at a later time by the crossing of the said moving averages.
No comments:
Post a Comment