Sunday, September 18, 2011
Sunday, August 21, 2011
Monday, August 15, 2011
CRB Index Touching Support
As discussed in a previous post in the beginning of May, the commodity CRB Index started a correction following three failed tests at the 61.8% Fibonacci retracement of the 2008 - 2009 plunge. The target of the correction was the 320 area which has been met recently as can be noticed in the updated daily chart above. The index strongly bounced from the 320 area right on the monthly cycle.
The updated weekly chart below shows that 300 - 320 could prove strong support due to the monthly rising uptrend line (now just above 300) connecting the 2009 and 2010 lows. Any break below 300 could send the index to 250 or even lower, while holding above 300 and turning higher could set the stage for a new test of the April - May 370 area. Trading wise, aggressive traders could go long due to the good risk/reward at this point. However, we should be aware that both daily and weekly charts are still in downtrends.
Sunday, August 07, 2011
US Treasury Bond Yields Leading World Equity Markets Lower
As noted here, here and here, the US 10-year treasury bond yield trends are leading the trends in other asset classes. Last week we had a good example of how US bonds are "leading" the equity markets around the world.
The 2.90 US 10-year Treasury bond yield support level, well discussed in the mentioned posts, eventually gave way and started the plunge on Friday July 29th, as noticed in the updated chart below:
On Monday August 1st, German DAX dropped through key support (6-month uptrend line and 200 SMA), see chart below:
Tuesday August 2nd was the day when key support levels were broken in many equity markets including the US S&P500 Index (levels discussed here, see updated chart below),
Sunday, July 10, 2011
EURRON Range-Trading Time
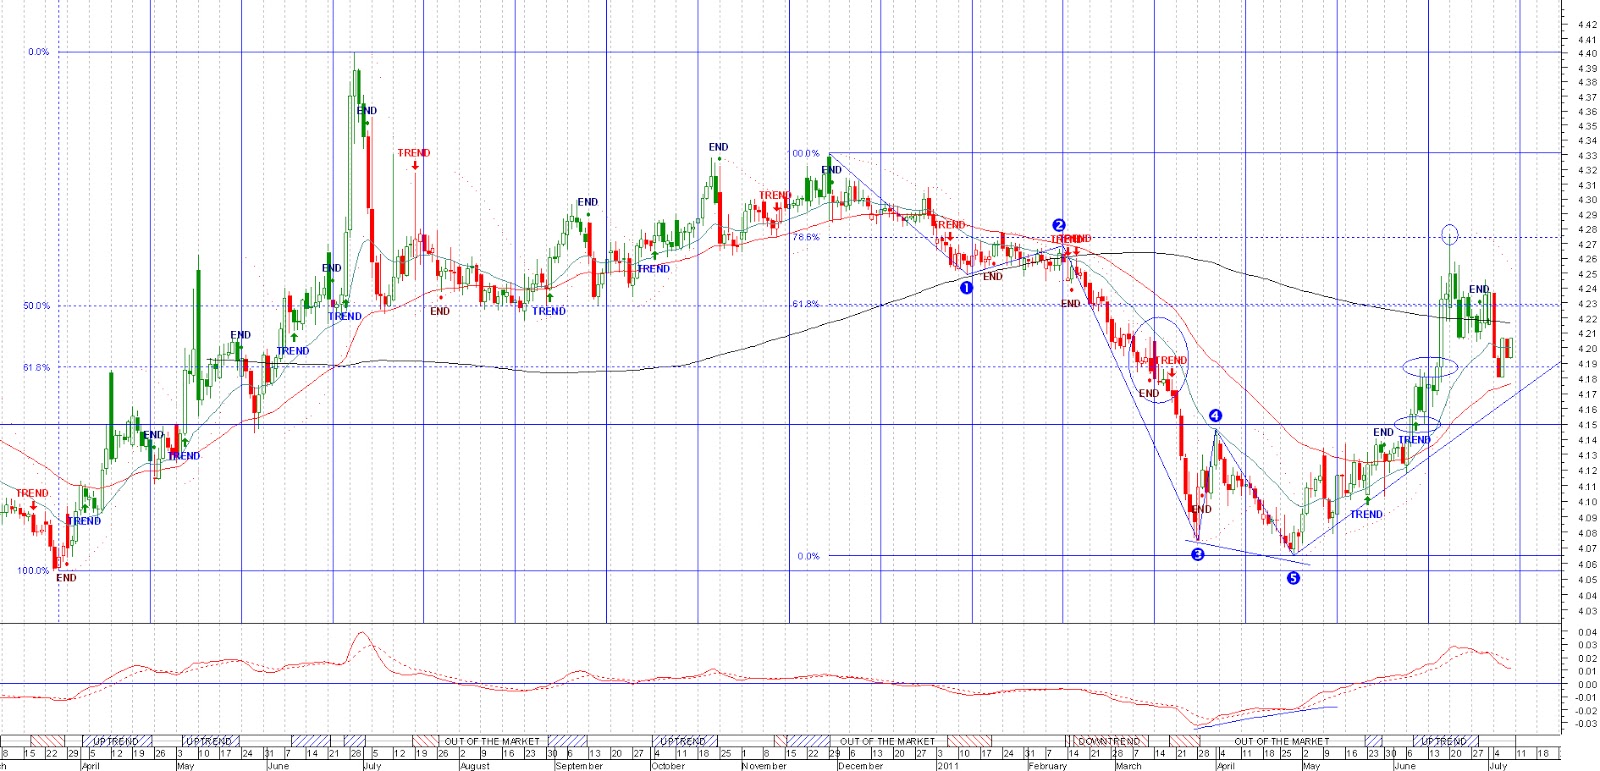
The EURRON reversal anticipated in a previous post happened as discussed, reaching each of the mentioned targets (4.15 and 4.19 - see the updated chart above) and then breaking higher in an impulsive move that took the rate to the 61.8% Fib retracement area around 4.23 and spiking towards the rarefied area bordered by 78.6% retracement around 4.2750.
The 4.23 - 4.275 area is a strong resistance that could propel the rate back to 4.33 if breached. A break below 4.19 area could send the rate back to 4.15 and towards this year lows around 4.06. The 4.19 - 4.23 in-between area is no man's land and a potential boring range. However, as long as EURRON stays below 4.23, the odds tilt towards resumption of downtrend by breaking below 4.19 later on.
Sunday, July 03, 2011
US 10-year Treasury Yield Halts on Target
This post title is the answer to a preceding post discussing the importance of the 2.90 level (see updated weekly and daily charts above and below).
The US 10-year treasury note yield halted on targeted mentioned level in June and reversed signaling the potential start of the summer rally in equities, commodities and the continuation of the dollar weakness.
Potential target for reversal is the weekly falling 200SMA and the downtrend line in the 3.40 - 3.50 area.
Markets Price to Moving Average Snapshot
Compare this table with the last week one. Notice the change in color on all three time frames and the switch of all US treasury notes yields from red to green signaling the potential start of the summer rally.
Sunday, June 26, 2011
Dow Jones World Stock Index - Healthy Correction or More Downside to Come?
As we notice in the weekly chart above, after touching the 178.6% Fibo extension of 2010 spring correction, the Dow Jones World Stock Index correction reached a critical long term support found at the confluence of 2010 - 2011 uptrend, Fibo fan line and the flat weekly 50EMA. A break below mentioned support could quickly target the next two Fibo fan lines support, otherwise the long term uptrend could resume and the world stock markets may challenge the May 2011 highs.
Zooming in through a daily chart below we notice a potential Head&Shoulders formation with a down sloping neck line that was broken, then tested thus the index being now theoretically prepared to drop to at least its H&S projected target that coincides with the second Fibo fan line support. A return above the neck line negates the bearish daily chart view.
If the drop towards the H&S projected target unfolds in the coming days and weeks, the world stock markets will remain under downward pressure.
Saturday, June 25, 2011
Subscribe to:
Posts (Atom)