Showing posts with label Currencies. Show all posts

Sunday, July 10, 2011

EURRON Range-Trading Time


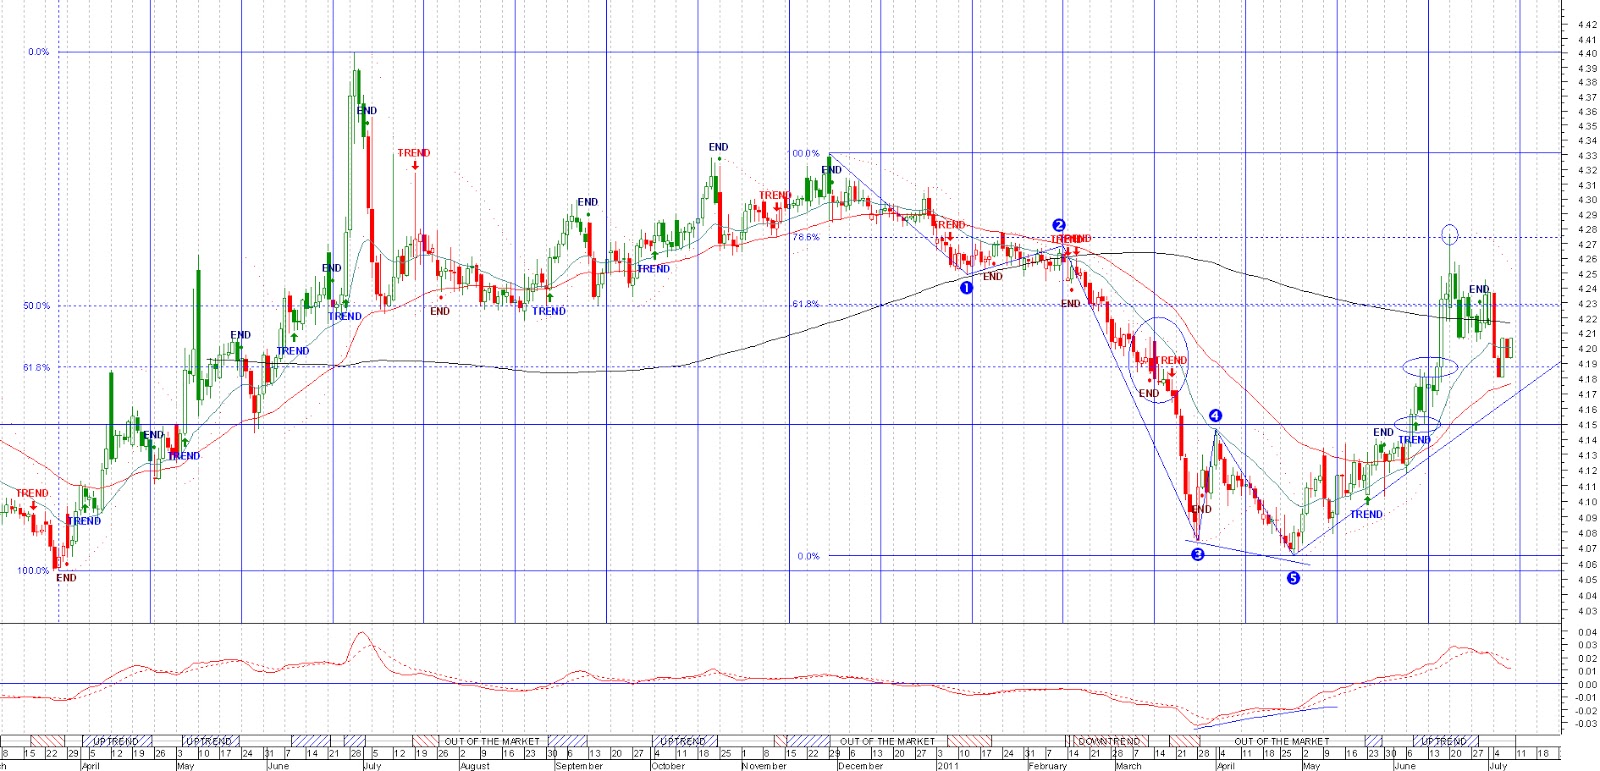
The EURRON reversal anticipated in a previous post happened as discussed, reaching each of the mentioned targets (4.15 and 4.19 - see the updated chart above) and then breaking higher in an impulsive move that took the rate to the 61.8% Fib retracement area around 4.23 and spiking towards the rarefied area bordered by 78.6% retracement around 4.2750.

The 4.23 - 4.275 area is a strong resistance that could propel the rate back to 4.33 if breached. A break below 4.19 area could send the rate back to 4.15 and towards this year lows around 4.06. The 4.19 - 4.23 in-between area is no man's land and a potential boring range. However, as long as EURRON stays below 4.23, the odds tilt towards resumption of downtrend by breaking below 4.19 later on.

Sunday, June 05, 2011

EURUSD Resumed Uptrend


The updated EURUSD daily chart above shows that the long term support area discussed in a previous post built the base for the renewed uptrend which set off right on the monthly cycle time. The next target should be the previous highs just below 1.50 and perhaps higher later on.

Nevertheless, we should check if the broken uptrend (now around 1.47) poses strong resistance. Failing to break higher could turn extremely bearish.

Monday, May 09, 2011

Potential EURRON Reversal


The correction in EURRON downtrend mentioned in a previous post proved to be the potentially 4th corrective wave of the 5-wave downtrend. The pair reversed from just shy of targeted 4.15 and melted down to marginally new lows towards last year targeted lows (around 4.06) in a clear divergence with the rising price oscillator (MACD). This set-up resolution was the short term reversal and the potential end of the 5th wave (not a harmonic one, though) which is usually followed by an a-b-c correction higher towards 4.15 and perhaps 4.19 later on.

EURUSD Uptrend Correction


As noted in a previous post, EURUSD moved higher and reversed just shy of the 1.5 target last week. The correction was harsh but the uptrend is intact as shown in the updated weekly chart above.

In the daily chart below we notice that EURUSD broke the uptrend correcting right on the cyclic time. Nevertheless, the area in the 1.40 -1.43 should prove strong support for the longer term uptrend and a base for a new leg higher to challenge the recent highs. A break below 1.40 is bearish medium term.

Monday, April 11, 2011

EURUSD Bullish Cycle Magic


The weekly chart above shows the EURUSD breakout higher through the downtrend challenging the 61.8% Fib level into the next 21-week cycle potentially targeting 1.50 - 1.515 area or even higher until August 2011.

Below we see the daily chart of the EURUSD breakout pushing higher when the 21-day cycle ticks.


Sunday, April 03, 2011

EURRON Downtrend Correction


As noted here and here, EURRON almost touched the targeted 2010 lows (around 4.06) after dropping through the critical 4.19 - 4.20 support area. The short term downtrend ended and a correction is in place with 4.15 and then 4.19 - 4.20 potential targets.

Nevertheless, EURRON is still bearish and a reversal could happen above the 4.19 - 4.20 area (now resistance). We may see a new band of trading between 4.10 and 4.20.

Saturday, March 05, 2011

EURRON Update

Eurron_daily_04-03-2011

As noted in a previous post, EURRON was heading towards the 4.19 - 4.20 area which was touched before bouncing higher (see the updated chart above).

A clear drop through the mentioned area increases the probability of a return to the 2010 lows (around 4.06) or even lower.

Tuesday, October 05, 2010

FX Chart of the Day - EURGBP


The area around 0.8750 seems an obviuos target for now..the strong trend in EURGBP is the reason behind GBPUSD underperformance against EURUSD.

Tuesday, September 28, 2010

End of journey for AUDUSD?


Looks like the area around 0.97 might be end of journey for Australian dollar for now..and since we have around 93% correlation between AUDUSD and S&P500, what can we expect from US equity market?


Thursday, September 23, 2010

Potential EURUSD Elliot Trip


We may be in the 3rd wave or at the beginning of the corrective 4th wave of the bigger impulse 3rd wave (III) that may take EURUSD to around 1.39 - 1.40 during the next weeks. Where are the US$ lovers?

Monday, August 25, 2008

The Dollar


Dollar! Dollar! burning bright
In the markets of the night
What subtle hand has bolstered thee
And caused the woeful buck's rally?

In what distant deep or land
Dwells the invisible hand?
Or as Europe sinks in the mire
Have euros been thrown in the fire?

Was it the ifo? GDP?
That caused the euro bulls to see?
Or was it oil? The fall of gold,
That turned the dollar bear trend old?

Who's the hammer? Make it plain,
Behind the rally, who's the brain?
Or is it just the P & L
Of the market, gone to hell?

When the market ran the stops,
And turned the dollar bears to flops,
Did the dollar start to smile,
To see itself now back in style?

Dollar! Dollar! burning bright
In the markets of the night
What subtle hand has bolstered thee
And caused the woeful buck's rally?


Source:


Saturday, May 05, 2007

GOLD, EURUSD and DJIA


As anticipated, GOLD managed to fully retrace to its February highs and even marginally exceeded them before correcting towards the 50-day moving average and the previous resistance (turned support) around the last Fibonacci retracement level (61.8%) of the March corrective trip. The Bulls are back in charge after a Doji signaled the resumption of the uptrend.


As noted in a previous post, the COT numbers stopped at the previous resistance turned support (around -130K) and rallied towards -180K accompanied by higher open interest supporting the bulls.


The EURUSD did break out on the monthly charts and marginally exceeded the December 2004 highs which seem to pose strong resistance. Furthermore, we have a 161.8% Fibonacci extension of the last autumn correction around the mentioned highs, strenghening the resistance beyond which 1.38 - 1.40 are the next targets.


The DJIA managed to breake the 13000 and the previous uptrend support turned resistance, heading towards the 161.8% Fibonacci expension of the March correction where it might stop given the high overbought readings of many technical indicators. Apart from this, "Sell in May and go away!" saying might reflect again the investors behaviour.

Thursday, April 12, 2007

EURUSD potential monthly breakout..


As noted in a previous post, the downtrend line coming from the 1994 and 2004 highs on the monthly charts should pose strong resistance. After several days of testing the area just below the trend line (see the daily chart below), EURUSD managed to pierce it today. Nevertheless, on a monthly chart (above), this may be only a false breakout for the moment unless we see strong follow through beyond 1.3500. In case of a real breakout, the 2004 highs around 1.3665 and beyond should be reachable targets in the near future.

Aprecierea leului este de neoprit..


In ciuda incercarilor BNR de a opri indirect caderea cursului EURRON prin sterilizari monetare masive sau prin reducerea ratei dobanzii de referinta, leul isi continua nestingherit aprecierea, ajungand aproape de al doilea prag important (de care aminteam si intr-un post de anul trecut) aflat in jurul valorii de 3.33, dupa ce suportul de la 3.40 a cedat. Trendul EURRON este puternic descendent si cursul poate cobori catre 3.20 daca 3.33 va ceda.

Tuesday, February 27, 2007

The Euro, Yen and Gold


On the daily chart above, EURUSD managed to surpass the last Fibonacci retracement (61.8%) of the correction trip from 1.3365 to 1.2865 on Friday and took off towards the previous high (1.3365).


The EURUSD monthly chart above shows us a downtrend line coming from 1995 which can pose good resistance around 1.3470 where we might have a turning point.


As I also noted in a previous post from October 2006, after breaking out of the triangle, the USDYEN advanced towards the resistance located around 122 where we have the last Fibonacci retracement level (61.8%) of the 135.19 - 101.65 trip. The resistance area rejected the price in January and February (see the monthly chart above) and the USDYEN turned back. Nevertheless, the mentioned resistance can be tested again in the following months due to the large interest rate differential between the dollar and the yen. On the other hand, BOJ started raising rates while the Fed is in stand by and therefore carry trades are weakening and may begin unwinding.


Gold was unleashed after escaping the 655 - 600 resistance area I mentioned in earlier posts which includes the 61.8% Fibonacci last retracement level of the latest monthly correction (729.70 - 543.20). This area turned support on a correction before conquering the next resistance around 675 which also became support. The highs so far quickly reached 688 on the way to full retracement towards 730, but the uprising channel gold formed during the last months is posing resistance and a temporary correction may start soon. The COT numbers (see below) were supporting this bullish phase last week after entering the upper channel between -130K and -220K accompanied by a sharply rising open interest.
Thursday, December 21, 2006

Leul isi arata din nou coltzii..


..la valute. Astazi EURRON a strapuns violent suportul 3.40, scazand chiar si sub 3.37 in timpul sedintei de tranzactionare valutara interbancara, BNR raportand la ora 13 un curs de 3.3801.

Asa cum banuiam intr-un post trecut, caderea redutei 3.40 s-a facut nestingherita de vreo interventie din partea Bancii Centrale, insa in functie de amploarea si viteza continuarii acestui trend sub pragul de 3.40, BNR ar putea interveni in orice moment. Daca in America interventia se face cu vorbe, in Romania probabil va fi nevoie de "cash" din visterie pentru a putea preveni adancirea unui soc economic generat de aprecierea excesiva si accelerata a monedei nationale.

Sunday, December 10, 2006

Chart of the Week - EURUSD


Above we have the Friday eurodollar show (on a 5 minute chart) with around 100 pips up and then around 150 pips down in three hours and a half!:) The event behind the show: Non-Farm Payrolls.


The hourly chart above shows us the triple top of last week and the break of a support around 1.3260, which should become the next resistance on the way back.

Monday, December 04, 2006

Leul se zburleste la valute..


In graficul saptamanal al EURRON se observa ca ne apropiem de suportul aparat agresiv de BNR in vara anului trecut (3.40). O cadere sub acest prag ar putea determina BNR sa intervina din nou, desi exista destul de multe sanse sa nu o faca si de data aceasta.

Astazi BNR a folosit pentru prima data dupa mult timp o parghie mai voalata de control a cursului de schimb, determinand reducerea dobanzilor prin atragerea a mai putin de 100% din oferta de lei a bancilor din sistem astfel ducand la micsorarea diferentialului de dobanda fata de alte piete, in incercarea de-a reduce apetitul speculatorilor transfrontalieri. (Sursa: ZF)

Daca insa cursul va cadea nestingherit sub 3.40, BNR ar putea interveni la trecerea prin anumite suporturi tehnice cum ar fi 3.35, 3.20, 3.00 sau prin orice alt suport ales de guvernatorul Isarescu:))


USDRON este in cadere libera intocmai cum se afla si dollarul pe pietele internationale (vs. alte monede, in special EUR si GBP). O interventie in forta a BNR pe piata EURRON (in principal) se va face insa simtita si pe USDRON.

Wednesday, November 29, 2006

Eurodollar may take a breather..


As we see on the daily chart above, a 261.8% Fibonacci extension (at 1.3217) of the last large bearish daily swing (1.2764 - 1.2483) has been reached.


On the weekly chart above wee see that the same top at 1.3217 is a 161.8% Fibonacci extension of the last large bearish weekly swing (1.2937 - 1.2483). We notice that the 261.8% Fibonacci extension is located exactly at the last 2004 highs (around 1.3665).

The 1.3217 top should act as intermediary resistance and trigger a correction that will offer new opportunities to enter long. The extent of the correction should not exceed 1.2980 (which was the top of the 6-month range) and be short-lived.

Sunday, November 26, 2006

The eurodollar has escaped the leash


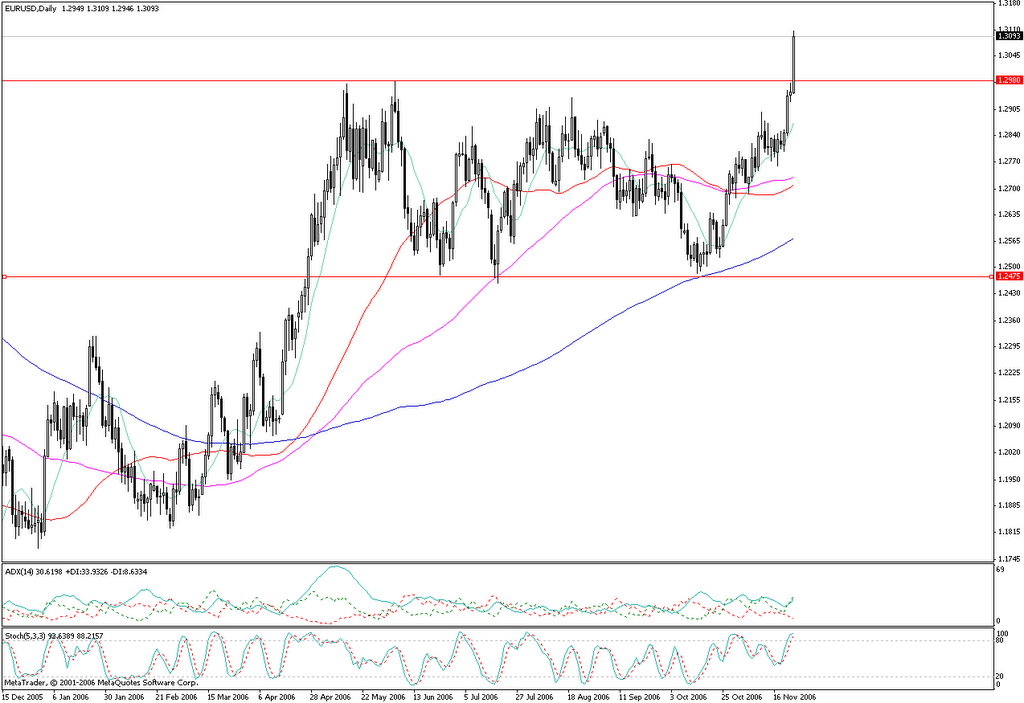
As observed in a previous post, the dollar weakness resumed and the long waited EURUSD breakout of a 6 month range and the break of an inverse head and shoulders neck eventually happened on Friday. On the daily chart above there are several technical indicators that support a continuation of the bullish trend. Apart from the breakout resistance that should become support at around 1.2980, we have a 10-day moving average at around 1.2875 which has been well tested since the end of October indicating a bullish sign and ascending support. The ADX is at trending levels (30 on Friday, a minimum of 25 is needed) with +DI furthering away from -DI and the Stochastic indicator reaches overbought levels but it prepares to stay there for a longer period of time.


On a monthly chart (above) we see that last week we had a break of the last Fibonacci retracement (61.8%) of the 1.3665 - 1.1640 trip, a break which this time was confirmed by a close above the Fibo level. This chart shows us two potential resistance levels before the last top (at 1.3665). The first one is around 1.33 (previous tops from a time when the chart was drawn using a basket of the currencies that disappeared when euro appeared in 1999) and the second one is towards 1.35 where we have a downward trend line coming from the 1995 highs.


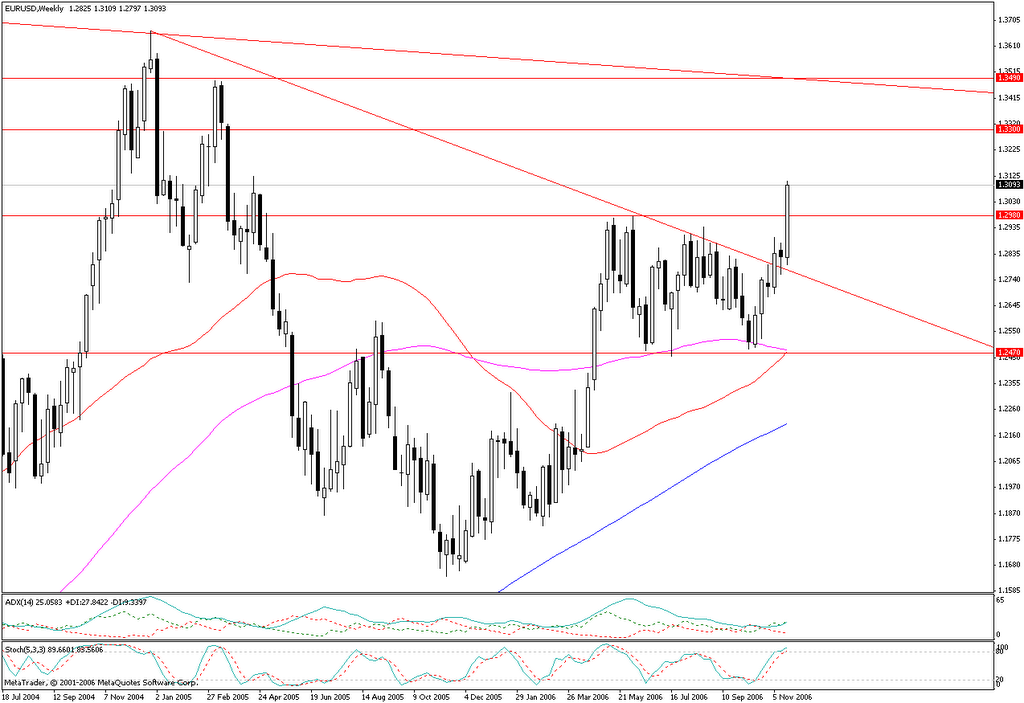
The weekly chart (above) shows us the downward trend line broken two weeks ago and the breakout of a 6-month-500-pip range. The EURUSD may run at least another 500 pips toward 1.35 where we have the 1995 started downward trend line we've seen on the monthly chart. Both ADX (25) and Stochastic are at trend ready levels but need confirmation. The same is true for the 50 day moving average which is about to cross the 100 day moving average. Since these crosses are lagging indicators of a trend, we can only imagine that we have a continuation of the bullish trend which will be confirmed at a later time by the crossing of the said moving averages.