Showing posts with label Commodities. Show all posts

Sunday, December 02, 2012

The GOLDen Consolidation Range

In the previous post discussing Gold in January 2011, it was said that “the next target after the following likely correction is 1600 which may be touched in January – March 2012. Nevertheless, we should be aware that the uptrend may accelerate and become exponential at some point and even higher highs may be registered in a shorter cycle than the regular 34-week cycle.”

After a shorter than expected correction, the uptrend indeed accelerated, tested and exceeded 1600 target in July 2011 overshooting towards 1900 in less than two months before collapsing back to 1600 area. Since September 2011 Gold is moving in a consolidating range between 1550 and 1800.


In the weekly chart above we have the 34 and 21-week cycles centred on the September 2011 important plunging low. The projected cycles point us to end-of-December and beginning-of-January as potential important inflection interval.

In terms of price we notice Gold is in the upper half of the mentioned range which improves the likelihood of a breakout higher in the direction of the long term uptrend thus putting an end to the long consolidation period. Nevertheless, a break below the mid-range around 1675 will most likely keep the price in the same range or even threaten the 1550 support area.


In the daily chart above we have 55-day cycle centred on the latest significant low from May 2012. The projection gives us beginning of January as a potential inflection period.

We notice Gold broke into the upper half of the range in September 2012, travelled to the 1800 resistance area then corrected 61.8% of the latest up-thrust which coincided with the 1675 mid-range. The upturned that ensued was capped so far by the 61.8% (1750) of the latest downtrend but the price is still in the upper half of the range.

1750 and 1800 levels are deemed as key for the next move in Gold. If 1750 is exceeded, Gold can challenge 1800 and stage a breakout in the direction of the long term uptrend.

A break below the mid-range around 1675 will push the price back in the lower half of the range and may even threaten the 1550 support area.

Sunday, August 21, 2011

Silver's Moving


Silver has started moving within a rising channel since July, after a two-month correction.

The 61.8% Fib retracement of the May - July correction (around 43) is now challenged and if broken opens the way for a test of the May highs (around 50) and perhaps for new highs later on.

Monday, August 15, 2011

CRB Index Touching Support


As discussed in a previous post in the beginning of May, the commodity CRB Index started a correction following three failed tests at the 61.8% Fibonacci retracement of the 2008 - 2009 plunge. The target of the correction was the 320 area which has been met recently as can be noticed in the updated daily chart above. The index strongly bounced from the 320 area right on the monthly cycle.


The updated weekly chart below shows that 300 - 320 could prove strong support due to the monthly rising uptrend line (now just above 300) connecting the 2009 and 2010 lows. Any break below 300 could send the index to 250 or even lower, while holding above 300 and turning higher could set the stage for a new test of the April - May 370 area. Trading wise, aggressive traders could go long due to the good risk/reward at this point. However, we should be aware that both daily and weekly charts are still in downtrends.

Monday, May 09, 2011

CRB Index Long Due Correction


The long and strong weekly uptrend in CRB Index mentioned in a previous post could not push past the magic 61.8% Fib retracement (turned unbreakable resistance diligently tested by the index during the last two months) and broke down with fireworks.

Nevertheless, we see still little damage to the weekly chart above despite the long red candle down. The steep uptrend just broken is usually replaced by a less steep one and the ongoing correction could be an opportunity to buy.

Looking at a daily chart below we see a 3-push higher bearish pattern with potential correction target around 320 which may be a good risk/reward level to go long.


Monday, April 11, 2011

CRB Index Marching Higher


As shown in the weekly chart above and the daily chart below, the CRB Index is making new highs pushing into the 61.8% Fib resistance which can be overcome this following week opening the way to the 2008 highs. Notice the strong and long still running weekly uptrend.


Wednesday, October 13, 2010

Chart of the Day - CRB Index


CRB Index has just reached a two year high and the trend is poised to continue longer term unless quickly turns down. We have a weekly chart above that indicates a potential target for the bullish run in the 320 - 340 area during the next several months. The trend is supported by the weakening dollar and by the Fed efforts to fight deflation through inducing inflation expectations via commodities.

The CRB Index has the following composition: Crude Oil (23%), Aluminum (6%), Copper (6%), Corn (6%), Gold (6%), Live cattle (6%), Natural Gas (6%), Soy beans (6%)Cocoa (5%), Coffee (5%), Cotton (5%), Heating oil (5%), Sugar (5%), Unleaded Gas (5%), Lean Hogs (1%), Nickel (1%), Orange juice (1%), Silver (1%), Wheat (1%)

Friday, October 08, 2010

The GOLDen Route Update


Gold followed its bullish route I mentioned one year ago on 17th of October 2009 in a post entitled "GOLDen Fibonacci Uptrend". The post included the chart above with the following price and time targets: "1250 (161.8% Fibonacci projection) then around 1400 (the 200% projection) and 1600 (261.8% Fibonacci projection). We also have the 34-week cycles in April 2010 and November - December 2010 when we may record new highs around the levels above or just inflection areas."

Below we have the updated chart where we notice that the first target (1250) was reached in May 2010 a month later than its cycle time while the second target (1400) is supposed to be reached in November - December 2010 but it's close already today on 8th of October (when registered a high just shy of 1365). In a later post I will discuss more on the potential price and time targets of Gold.


Saturday, October 17, 2009

GOLDen Fibonacci Uptrend


As shown in the weekly chart above, Gold is in a secular bull market since 1999 and has just broke out to new highs. The last deep retracement in 2008 was around 61.8% of the previous bull run between 543 (in 2006) and 1032 (in 2008).


In the next weekly chart above we see the deep correction of the 2006 (from 730 to 543) with the first bounce towards the 61.8% retracement (around 660). Then, after the bull market took out the 660 retracement, we see each Fibonacci extension (161.8% around 845 and 261.8% around 1032) consecutively reached in the next two years. We also notice how the gold market pauses at each of the important Fibonacci levels in the 2008 correction before going higher.

Before going to the third weekly chart below, I will quote from an article written by Mukul Pal, CEO of Orpheus Capitals, a global alternative research firm entitled The Gold Cycle:

"The 34 year gold cycle guides liquidity flow from equity to gold, as money shifts from paper to hard assets.Peter Cogan mentioned about the Gold crisis cycle of 34 years in his article on predetermined periodic cycles of optimism and pessimism. The 1967-68 Gold crises, which climaxed with the end of Bretton Woods system followed the 1933-34 Gold crisis. The article written in 1969 issue of CYCLES was visionary and is the only reference in nearly 70 years of CYCLE literature. But the more interesting part is that the CYCLE is still valid and working. After the gold crisis of 1967-68 we saw the crisis of 2000, where people believed in technology stocks and the paper dreams they offered compared to the hard asset."

Based on the 34 year gold cycle mentioned in the excerpt above and on the assumption that markets behave the same in lower time frame cycles, in the weekly chart below I divided the last almost 10 years of bull market in 34 weekly cycles starting from the 2006 highs. We notice that around each cycle we have inflection areas either in the form of a new high or of a correction low or just an inflection area that sets off a strong move.

Since Gold has jus broken out to new highs we may look for the next target levels according to the Fibonacci extensions/projections of the last correction in 2008. These levels are 1250 (161.8% Fibonacci projection) then around 1400 (the 200% projection) and 1600 (261.8% Fibonacci projection). We also have the 34-week cycles in April 2010 and November - December 2010 when we may record new highs around the levels above or just inflection areas.


And by the way, 34 is also a Fibonacci number (13+21)! :)

Now let's see if the assumptions regarding the patterns explained in this post prove to be true.

Saturday, May 05, 2007

GOLD, EURUSD and DJIA


As anticipated, GOLD managed to fully retrace to its February highs and even marginally exceeded them before correcting towards the 50-day moving average and the previous resistance (turned support) around the last Fibonacci retracement level (61.8%) of the March corrective trip. The Bulls are back in charge after a Doji signaled the resumption of the uptrend.


As noted in a previous post, the COT numbers stopped at the previous resistance turned support (around -130K) and rallied towards -180K accompanied by higher open interest supporting the bulls.


The EURUSD did break out on the monthly charts and marginally exceeded the December 2004 highs which seem to pose strong resistance. Furthermore, we have a 161.8% Fibonacci extension of the last autumn correction around the mentioned highs, strenghening the resistance beyond which 1.38 - 1.40 are the next targets.


The DJIA managed to breake the 13000 and the previous uptrend support turned resistance, heading towards the 161.8% Fibonacci expension of the March correction where it might stop given the high overbought readings of many technical indicators. Apart from this, "Sell in May and go away!" saying might reflect again the investors behaviour.

Thursday, April 12, 2007

Gold continues the uptrend..


As noted in "Gold starts rising again..", Gold returned to the bullish side, stumbled over the last Fibonacci retracement level (61.8%) of the correction from the upper to the lower bullish channel lines then exploded towards the latest highs around 688. If the mentioned highs are surpassed, the upper bullish channel resistance and last year's highs around 730 will be the next targets.

Saturday, March 17, 2007

Gold starts rising again..


As mentioned in a previous post on Gold, the upper rising channel resistance triggered a correction sending the price towards the lower rising channel support and stumbling over a previous resistance turned support around 630 - 635 area which ended the correction. The COT numbers fell towards the support around -130K and should have started rising, as we will probably notice in the next week COT report. If the 655 - 660 previous resistance turned support and now turned resistance again area gives in, the gold bullish march should be back on its track to full retracement towards last year's highs (around 730).

Tuesday, February 27, 2007

The Euro, Yen and Gold


On the daily chart above, EURUSD managed to surpass the last Fibonacci retracement (61.8%) of the correction trip from 1.3365 to 1.2865 on Friday and took off towards the previous high (1.3365).


The EURUSD monthly chart above shows us a downtrend line coming from 1995 which can pose good resistance around 1.3470 where we might have a turning point.


As I also noted in a previous post from October 2006, after breaking out of the triangle, the USDYEN advanced towards the resistance located around 122 where we have the last Fibonacci retracement level (61.8%) of the 135.19 - 101.65 trip. The resistance area rejected the price in January and February (see the monthly chart above) and the USDYEN turned back. Nevertheless, the mentioned resistance can be tested again in the following months due to the large interest rate differential between the dollar and the yen. On the other hand, BOJ started raising rates while the Fed is in stand by and therefore carry trades are weakening and may begin unwinding.


Gold was unleashed after escaping the 655 - 600 resistance area I mentioned in earlier posts which includes the 61.8% Fibonacci last retracement level of the latest monthly correction (729.70 - 543.20). This area turned support on a correction before conquering the next resistance around 675 which also became support. The highs so far quickly reached 688 on the way to full retracement towards 730, but the uprising channel gold formed during the last months is posing resistance and a temporary correction may start soon. The COT numbers (see below) were supporting this bullish phase last week after entering the upper channel between -130K and -220K accompanied by a sharply rising open interest.

Sunday, February 11, 2007

Gold removes the resistance..


After reaching the 655 - 660 resistance area I mentioned in earlier posts, Gold bounced back, tested the broken downtrend line, regained strength and broke through, removing the last Fibonacci resistance, the 61.8% retracement level of the 729.70 - 543.20 corrective trip. As I pointed out in a previous post, the next resistance level should be around 675 (around a previous top). The COT numbers broke out, as well, reaching levels unseen since May 2006. The open interest starts easily climbing and indicates new highs may be in the cards.


Sunday, January 28, 2007

Gold is approaching resistance..


Gold did bottom in the 600 - 610 area and rallied just shy of 655 resistance (underlined in the previous post) where it bounced back. The 655 - 660 area is a strong resistance around the last Fibonacci retracement level (61.8%) of the 729.70 - 543.20 corrective trip. The COT numbers show levels very close to previous tops located in the (-115K, - 130K) interval, suggesting that Gold might stumble over the mentioned resistance area and head back towards 600's support, enforcing the range-driven market. If the 655-660 resistance area gives way, the next resistance level should be around 675 (around a previous top).

Sunday, January 14, 2007

A Gold Bottom Might Be In Place


As noted in a previous post, the area between 600 and 610 provided good support for gold, despite breaking the lower uptrend channel support, which survived the first test. The strong bounce off the mentioned support area and a possible bottom around -80.000 noted in the COT numbers (see below) should see gold go for a new bullish leg towards 655.

Monday, December 18, 2006

Gold Correction


The Bullish Golden Route is having a setback towards the lower uptrend channel support. The 630 line gave way and already retraced 50% of the latest rally (572 - 649). The area between 600 and 610 should be a strong support that will probably bottom this correction.

Tuesday, November 28, 2006

The Bullish GOLDen Route


Gold has eventually managed to decisively break and close above the last Fibonacci retracement (61.8%) of the 676 - 559 trip and started the full retracement back towards 675, as noted in a previous post. The upper bull trend channel from October and the previous highs at around 655 might pose some resistance while 630 should become support.


The bullish route is backed by higher commercials net shorts and finally by increasing open interest (as seen in the chart above) which strengthens the trend.

Sunday, November 05, 2006

Gold becomes bullish


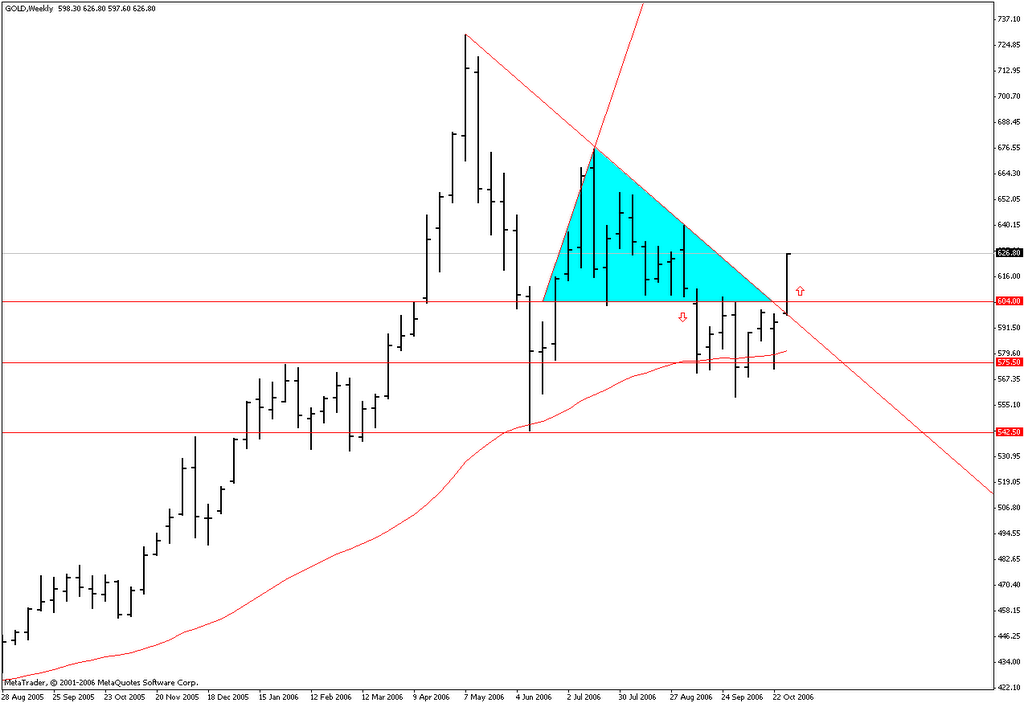
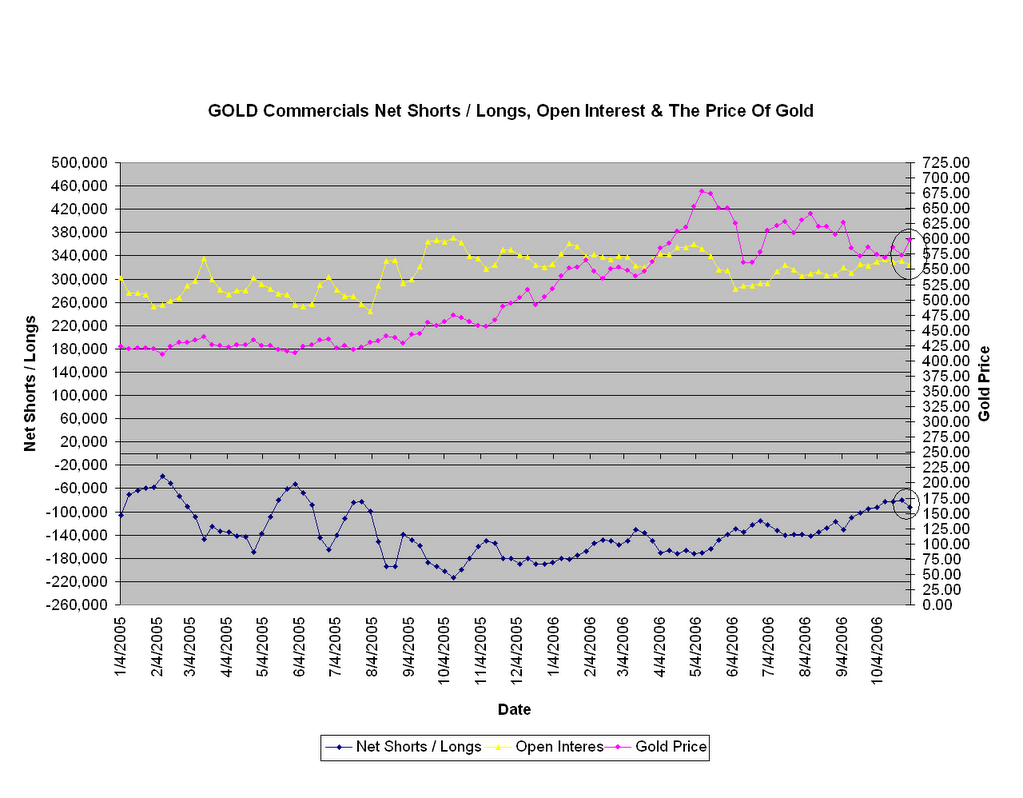
Gold managed to break the line in the sand together with an important bearish trend line coming from the heights of May. The latest release of the COT report (below) shows that we may have a bottom in place because the net short commercial traders positions increased while gold rallied. Therefore, gold looks very bullish at the moment.


Still, we have the same warning sign I wrote about before: the open interest which is easily falling while gold rallies. If we are to see a strong bullish trend ahead, we should have an increase in the open interest as well, which means opening more long positions (more bullish confident traders) accompanying the rise in gold price.

Nevertheless, the technical setup is bullish and the first target (almost reached) is around 630 where we have the 61.8% Fibonacci retracement of the last sell off (676 - 559). Only after this resistance is fully breached, the next target becomes the full retracement back towards 675 - 676. The last resistance 600 now should become support.

Sunday, October 15, 2006

Is Gold trying to bottom?


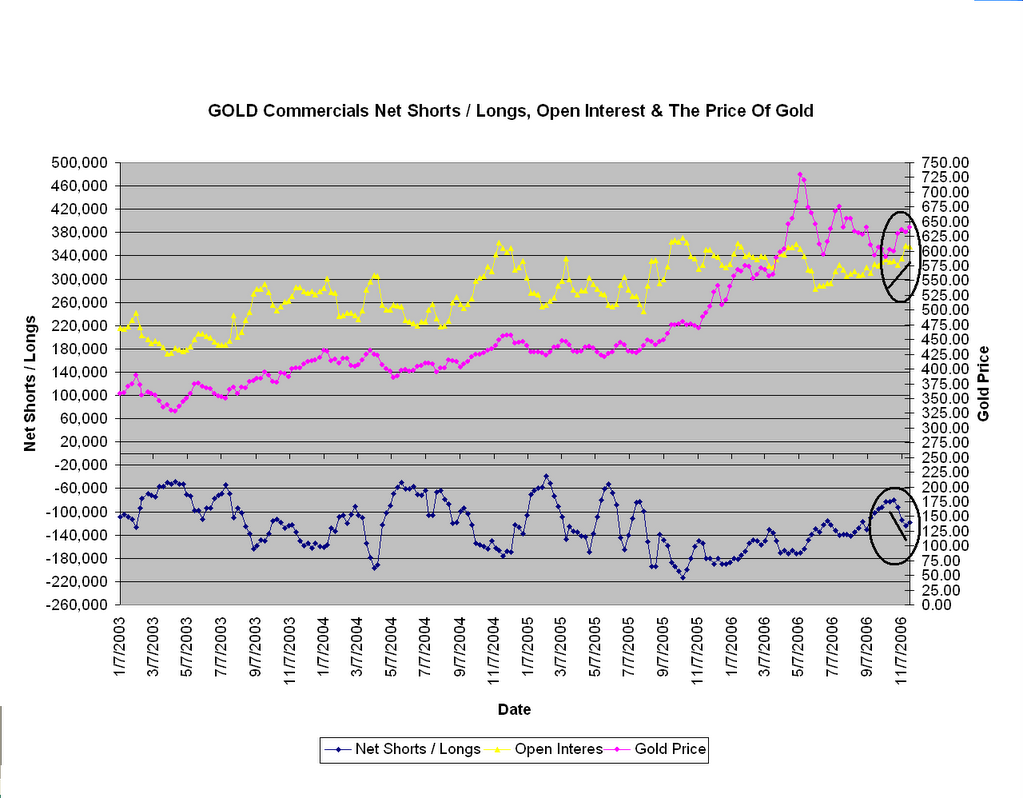
The latest Commitment of Traders (COT) report shows the lowest net short commercial positions (82.602) since June 2005 and around the low of July 2005 (82.809). Gold used to bottom when the commercial COT numbers fell in 40.000 and 60.000 until spring 2005. Afterwards when the gold rally picked up speed, the bottoming took place between 115.000 and 130.000 net short commercial positions until September 2006 when gold COT numbers fell through 100.000 down towards the June 2005 lows.

Now we can assume that given the strong gold bull market, the bottoming may take place at higher levels (let’s say around 80.000). If this is the case, the bottom may be already in place since the latest COT number is around this figure.

Nevertheless, there is a warning signal given by the open interest. We notice in the chart above that every time gold is in a correction phase and falling, both open interest and commercial net short positions in gold (the absolute number of the COT numbers, the “-“ is just indicating we have net short positions) are falling. But during the last month, gold prices are falling, COT numbers are falling and the open interest is smoothly rising (see the thick indicating lines). What should this signal? A quick resume of the uptrend or just a warning sign that correction is not over yet and on the contrary it is here to last? The answer lies in the weeks ahead and the line in the sand is 600. Until then, no trade is the best trade!