Showing posts with label Fixed Income. Show all posts

Wednesday, October 31, 2012

10-year Treasury Yield to Show the Way


Signs of strength in the economy usually push treasuries lower and yields higher. Signs of weakness usually put a bid into treasury prices and push yields lower.
Chart above shows the 10-year Treasury Yield ($TNX) hitting resistance in the 18.5-19 area and falling back the last two days. The trend since late July is up, but this failure at resistance is not encouraging for stocks. Notice that stocks and treasury yields are positively correlated for the most part. A breakout at 19 (1.9%) would be bullish for yields, bearish for treasury bonds and bullish for stocks. Downside follow through below 16 (1.6%) would be bearish for yields, bullish for treasury bonds and bearish for stocks. 
This week’s economic data may tilt the balance and we could see a decisive move after the election. Directional movement could be limited until we get some clarity on the election.

Sunday, August 07, 2011

US Treasury Bond Yields Leading World Equity Markets Lower

As noted here, here and here, the US 10-year treasury bond yield trends are leading the trends in other asset classes. Last week we had a good example of how US bonds are "leading" the equity markets around the world.

The 2.90 US 10-year Treasury bond yield support level, well discussed in the mentioned posts, eventually gave way and started the plunge on Friday July 29th, as noticed in the updated chart below:


On Monday August 1st, German DAX dropped through key support (6-month uptrend line and 200 SMA), see chart below:


Tuesday August 2nd was the day when key support levels were broken in many equity markets including the US S&P500 Index (levels discussed here, see updated chart below),


the Romanian BETXT Index (levels discussed here, see updated chart below),


and the Dow Jones World Stock Index (levels discussed here, see updated chart below).


Sunday, July 03, 2011

US 10-year Treasury Yield Halts on Target


This post title is the answer to a preceding post discussing the importance of the 2.90 level (see updated weekly and daily charts above and below).

The US 10-year treasury note yield halted on targeted mentioned level in June and reversed signaling the potential start of the summer rally in equities, commodities and the continuation of the dollar weakness.

Potential target for reversal is the weekly falling 200SMA and the downtrend line in the 3.40 - 3.50 area.


Monday, June 13, 2011

US 10-year Treasury Yield Halts on Target?


As noted in a previous post, the US 10-year treasury yield started a downtrend that signaled turning points for the other asset classes (commodities, equities and the US dollar). In the updated weekly chart above and daily chart below we can see the two discussed targets, 3.05 - 3.10 area and 2.90 were sequentially reached around monthly cycle lines.

The consistent break of the 2.90 area this month could send the US 10-year treasury yield towards last year's low around 2.35 and could also keep pressure on equities and commodities while potentially pushing the dollar higher during the summer and year end. If the 2.90 area is holding this month then we could see summer relief rallies in equities and commodities and continuing dollar weakness at least until autumn or literally "fall" :).


Monday, May 09, 2011

US 10-year Treasury Yield Bearish Fakeout


In a previous post I highlighted the bullish potential breakout of the US 10-year Yield Note but it turned out to be a false breakout just two days after. It was an early warning sign of the commodities, dollar and equities markets last week's corrections due to the break in the cemented inter-market (asset classes) relationships: bonds down (yields up), dollar down, commodities and equities up.

In the weekly chart above we notice new lows for the yields piercing the last Fibo fan level and potentially heading even lower towards 2.9 if this area gives in. In the daily picture below we see a monthly three push higher which usually has a bearish resolution. A clear downtrend is in the process with potential target 3.05 - 3.10 area (SMA200, 50% retracement and 21-day cycle line). Below we have the mentioned 2.9 (last Fibo retracement and previous congestion area).


Monday, April 11, 2011

US 10-year Treasury Yield Pushing Higher


We notice the bounce in bond yield form the 20 and 50 EMAs back above the 200 SMA in the weekly chart above.

The daily chart below shows the break above 61.8% Fib level up trending towards latest February high. Both charts are bullish and could target the 4% strong resistance area.


Tuesday, October 12, 2010

Chart of the Day - US 10-year Treasury Note


As noticed in the weekly chart above, the US 10-year Treasury Note is in a strong downtrend triggered by the weekly SMA200 and 34-week time cycle. This technical setup was supported by Fed bond purchases - or the Fed actions were supported by this technical setup:) - to push longer term yields lower in order to underpin economic growth.

Wednesday, September 27, 2006

US Inverted Yield Curve

It seems that bond traders have a gloomy near future American economic outlook. The yields of the long term treasury bonds have dropped sharply lately and the yield curve has been inverted for some time. This means the long term (10 or 30 year) Treasury note yields fell below the shorter term Treasury bonds and Federal Reserve discount rate (at 5.25%) and when this happens, economists say the yield curve is inverted and they forecast recession in the following months. The rationale behind it is related to the behavior of investors who buy more long term bonds than short term ones, thus securing good coupon rates in the long run, while they predict a difficult economic period ahead which might force cutting interest rates in the short run and reduce their potential gain on both long and short term future newly issued bonds. Since bond prices and bond yields are inversely related, when investors buy more long term bonds, their prices rise and their yields fall, as we notice in the charts below:
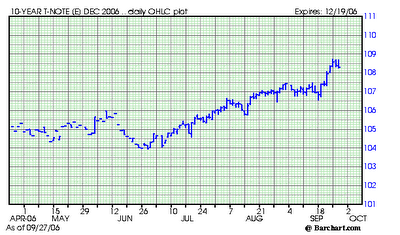


Above is the chart of the 10 Year Treasury Note and bellow is the chart of the 10 Year Treasury Note Yield (now at around 4.6%).
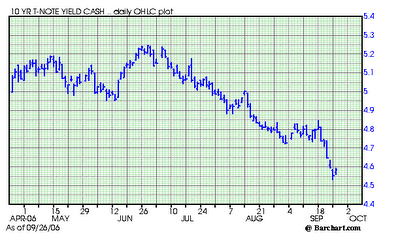

Therefore, the inverted yield curve predicts recession ahead (as it predicted several times in the American economic history, including in 2000). Nevertheless, the stock market in US is making new highs, approaching the historical year 2000 highs and the dollar is stubbornly strong compared to several months ago (though we cannot ignore the fundamental positive interest rate differential especially against EUR or JPY). Economists say the same happened in 2000 before the recession and this time can’t be different. What’s obvious, though, is the slowing of the American economy (and especially the housing market) which is actually normal due to the high interest rates the FED has arrived at after a strong and measured two year rally. That’s why, at some point, I believe this economic slowdown will also be reflected in the financial markets, (following the commodity markets where this slowdown has already been reflected).