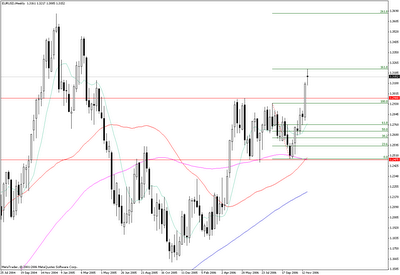
As we see on the daily chart above, a 261.8% Fibonacci extension (at 1.3217) of the last large bearish daily swing (1.2764 - 1.2483) has been reached.

On the weekly chart above wee see that the same top at 1.3217 is a 161.8% Fibonacci extension of the last large bearish weekly swing (1.2937 - 1.2483). We notice that the 261.8% Fibonacci extension is located exactly at the last 2004 highs (around 1.3665).
The 1.3217 top should act as intermediary resistance and trigger a correction that will offer new opportunities to enter long. The extent of the correction should not exceed 1.2980 (which was the top of the 6-month range) and be short-lived.
No comments:
Post a Comment